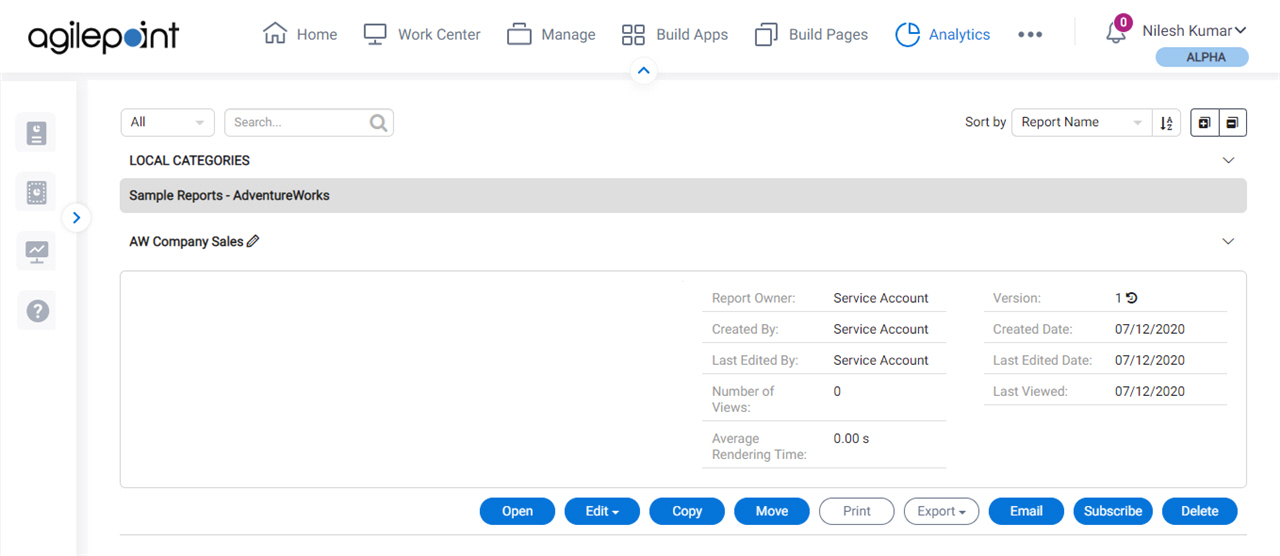
Analytics Center
The Analytics Center is an AgilePoint NX component where you can create, run, and configure reports and reports settings related to data in your apps. With Analytics Center you get the following:
- Advanced Visualization – Get a view of real-time information displayed in impactful charts and graphs, and present it in a more persuasive way.
- Interactive, Ad-hoc Dashboards – Building dashboards in Analytics Center is easy and intuitive, and dashboard are interactive with drill down and cross filtering support.
- Intuitive Report Builder with Live Preview – Never built a report? No problem: A wizard is there to help guiding you through the easy process, and a live report preview feature lets you see in real time how your report will look.
- Responsive Design - Consistent experience on any device.
- Adaptive and Responsive – Mobile, tablet, and high-resolution display ready.
- Sharing – Email the report or dashboard link, and embed it, or attached it as a file (Word, Excel, PDF, XML, CSV, JSON).
- Enterprise-Level Governance – Robust governance through fine grained permission control at both tenant level as well as individual report level.
- Integrated Security - Enterprise grade security controls at the tenant and report level.

Related Topics
Video: Create Your First Report
Video: AgilePoint Platform Overview
About This Page
This page is a navigational feature that can help you find the most important information about this topic from one location. It centralizes access to information about the concept that may be found in different parts of the documentation, provides any videos that may be available for this topic, and facilitates search using synonyms or related terms. Use the links on this page to find the information that is the most relevant to your needs.
Keywords
Analytics Center, analytics, reports, reporting


