
(Example) Configure the Chart Form Control
This example shows how to configure the Chart form control.
Background and Setup
Result
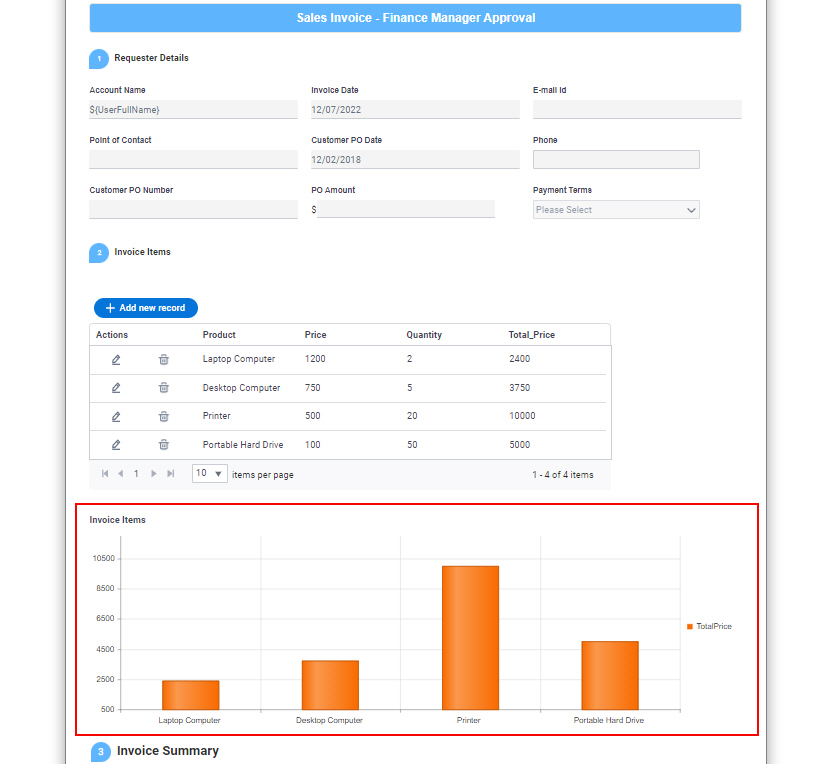
This example shows how to configure the Chart form control in the Finance Manager Approval form to show a chart of how much a customer spends on the items. The data in this chart is retrieved from a Microsoft Excel file with an Auto-Lookup form control.
Prerequisites
- This example topic uses the lookup created in the (Example) Configure an Auto-Lookup Form Control with Microsoft Excel. Refer to that topic for more information about configuring the lookup.
The lookup name is Sales Invoice Items.
- This example uses the Microsoft Excel file
created in (Example) Create a Microsoft Excel File to Use as a Data Source for an App.
Refer to that topic for information about configuring the Excel file.
The Microsoft Excel file name is Sales Invoice Items.xlsx.
- This example uses the Sales Invoice app from the AgilePoint NX App Store.
For more information, refer to How to Get the App
Good to Know
- The Sales Invoice app creates an invoice for a product sale.
For the use case in this example, the Finance Manager Approval form shows a chart of how much a customer spends on the items.
- In this example, an app designer configures the Chart form control
with the Sales Invoice Items lookup that was used on the Sales Invoice Request form in the Invoice Items field
to populate the data from a Microsoft Excel file.
For more information, refer to:
Step 1: Configure the Chart Form Control with a Lookup
First, configure a chart form control with a lookup in an eForm.
How to Start
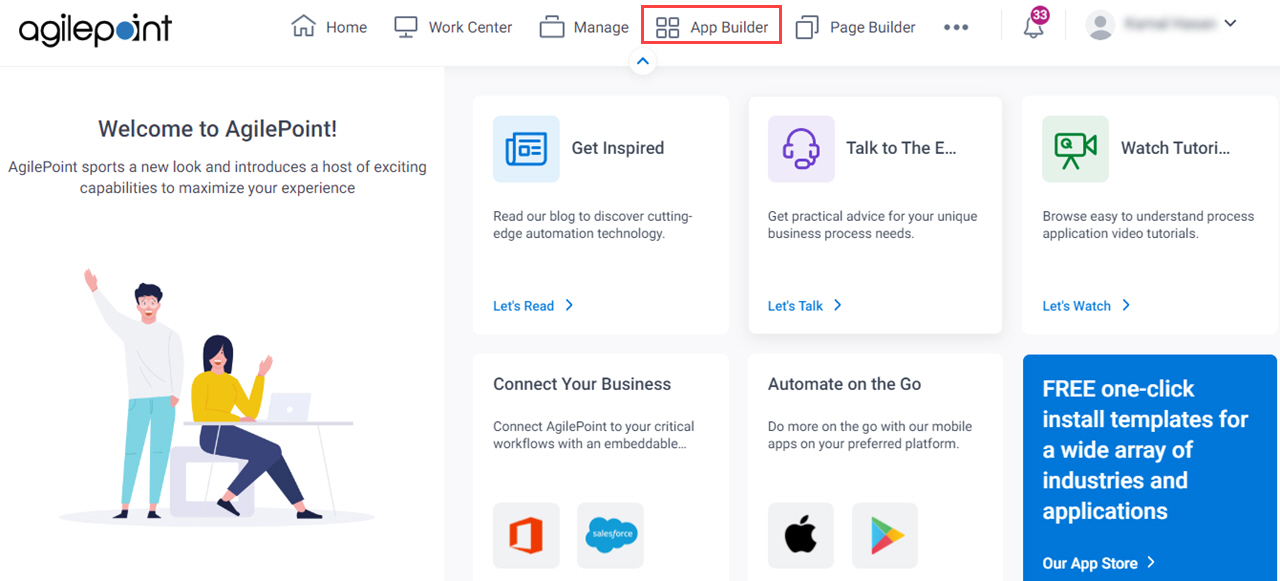
- Click App Builder.
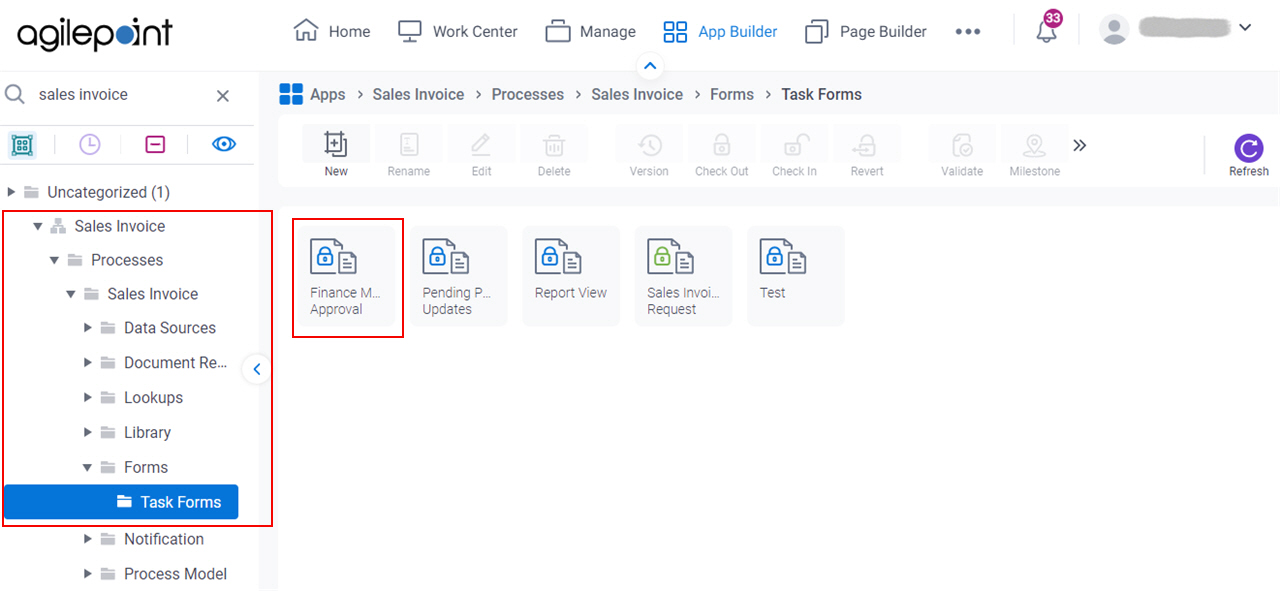
- On the Application Explorer screen,
click Sales Invoice > Processes > Sales Invoice > Forms > Task Forms > Finance Manager Approval.
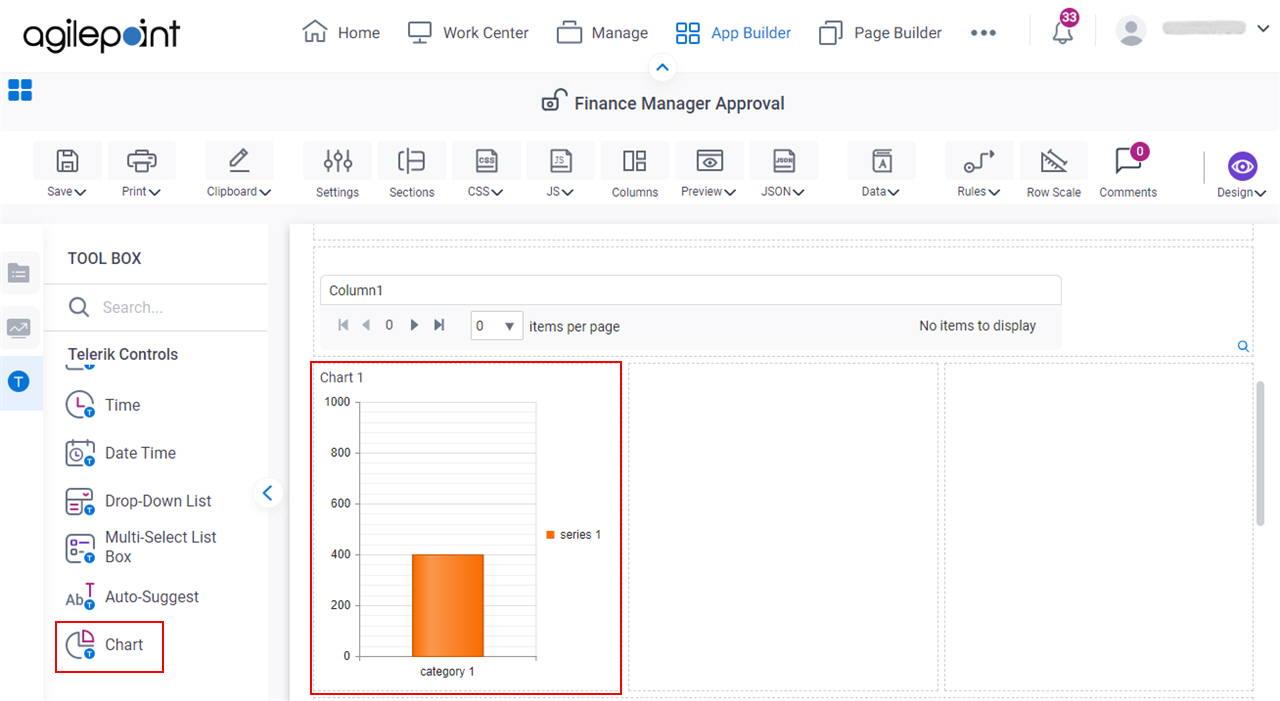
- On the Finance Manager Approval form, in the Tool Box, open the Telerik Controls tab.
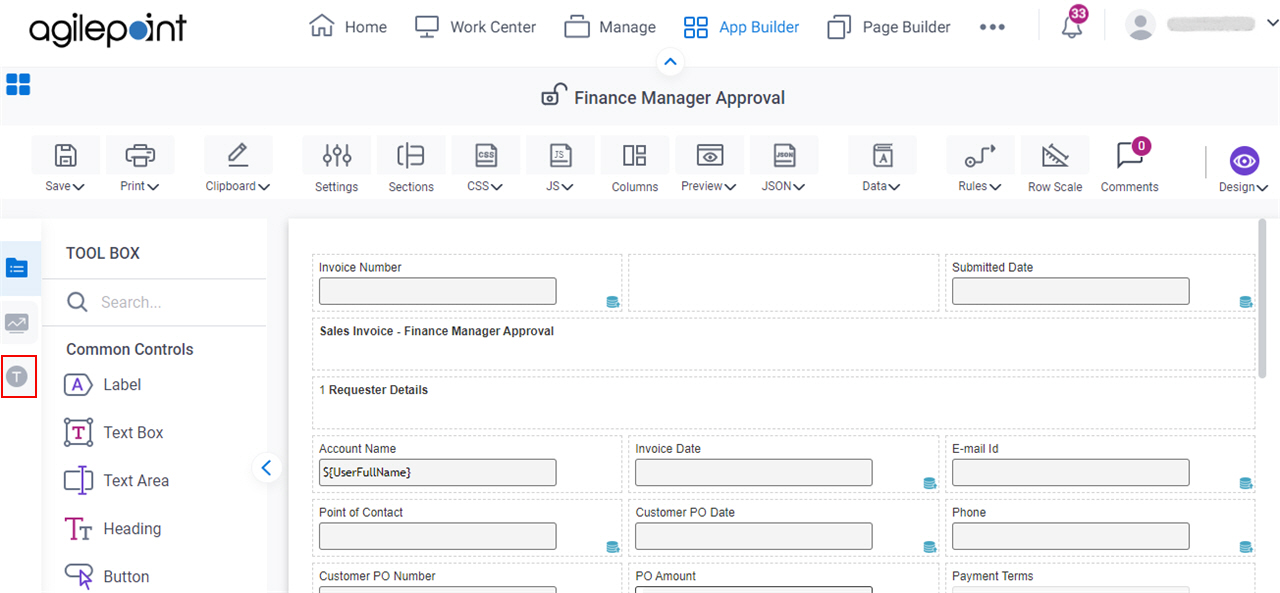
- On the Telerik Controls tab, drag the Chart
form control onto your eForm.
Procedure
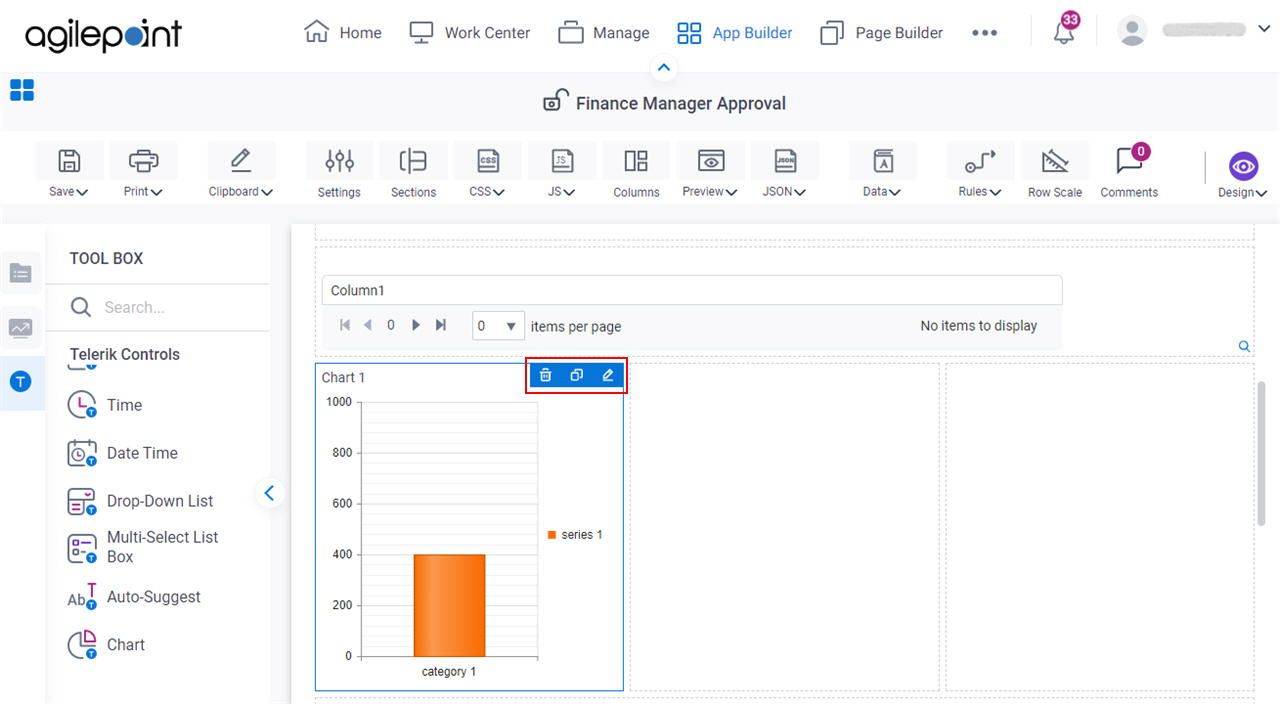
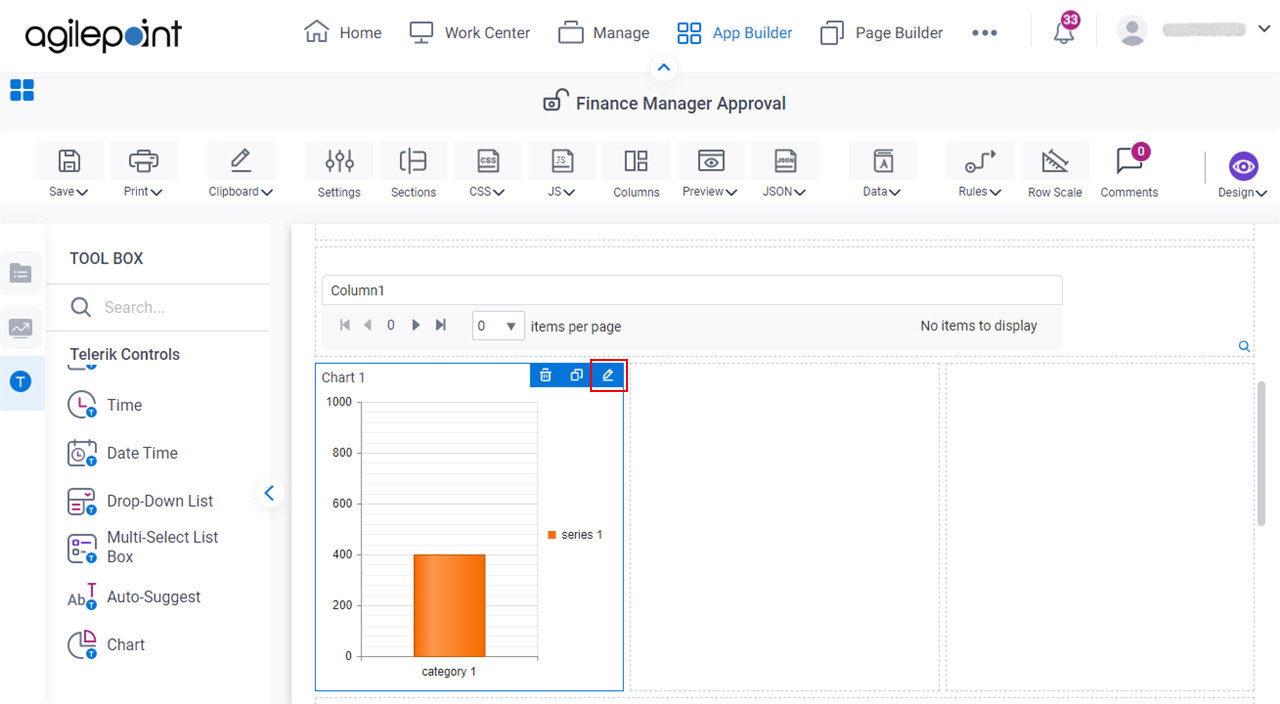
- On the Finance Manager Approval form, put your cursor over the Chart form control, and the form control toolbar shows.
- Click Edit Properties
 .
.
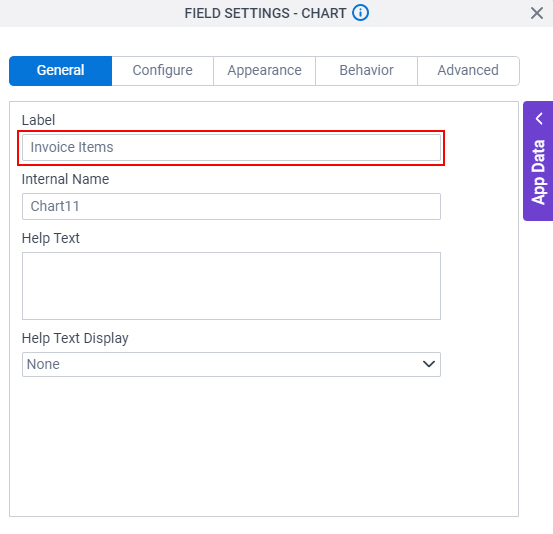
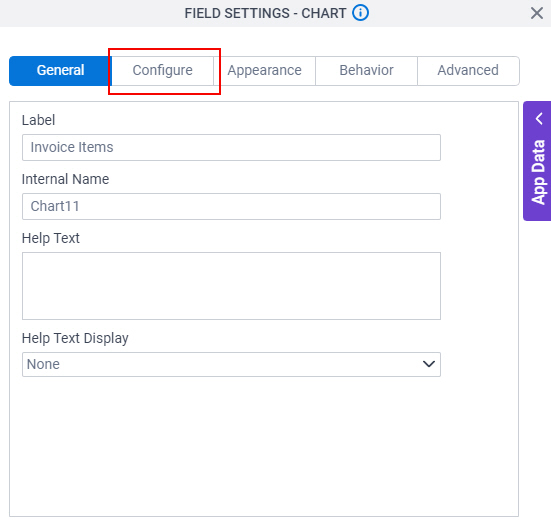
- On the Field Settings - Chart screen, in the Label field, enter Invoice Items.
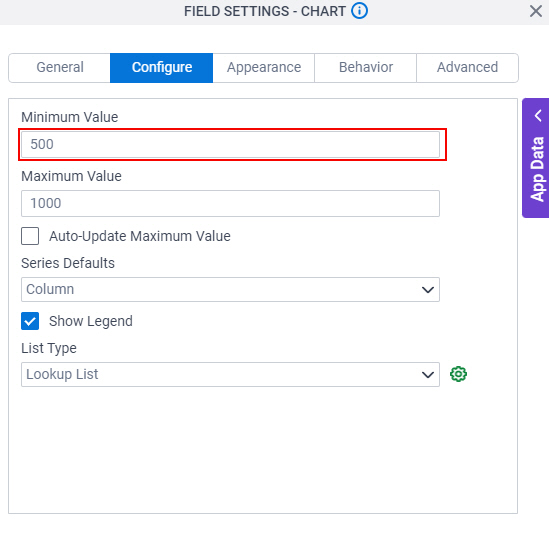
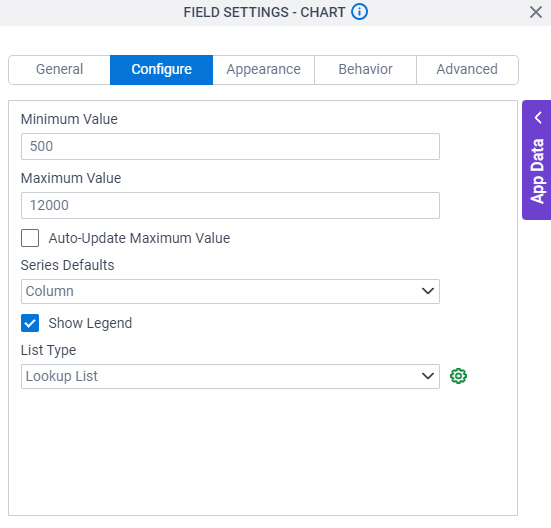
- Click the Configure tab.
- On the Configure tab, in the Minimum Value field, enter 500.
This is an example value. The value you enter in this field should make the chart show the data that is the most relevant for a runtime app user. This depends on the data the Chart form control is likely to show based on your business requirements.
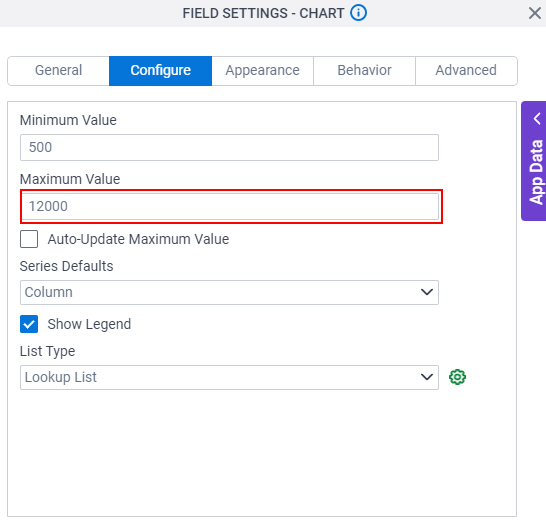
- In the Maximum Value field, enter 12000.
This is an example value. The value you enter in this field should make the chart show the data that is the most relevant for a runtime app user. This depends on the data the Chart form control is likely to show based on your business requirements
- In the Series Defaults field, select Column.
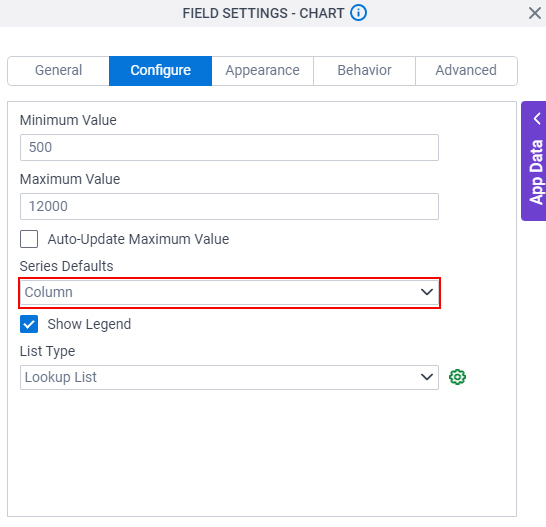
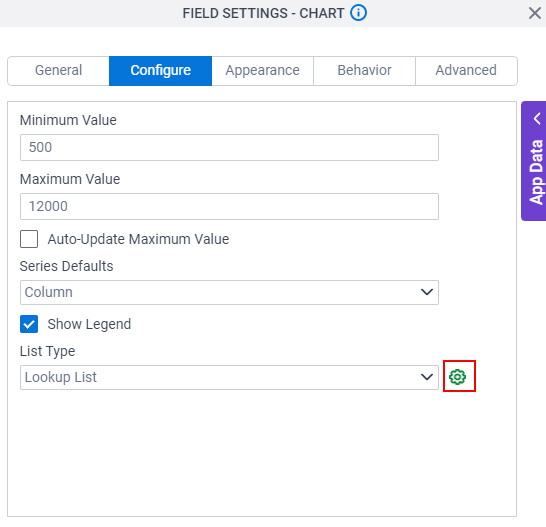
- In the List Type field, select Lookup List.
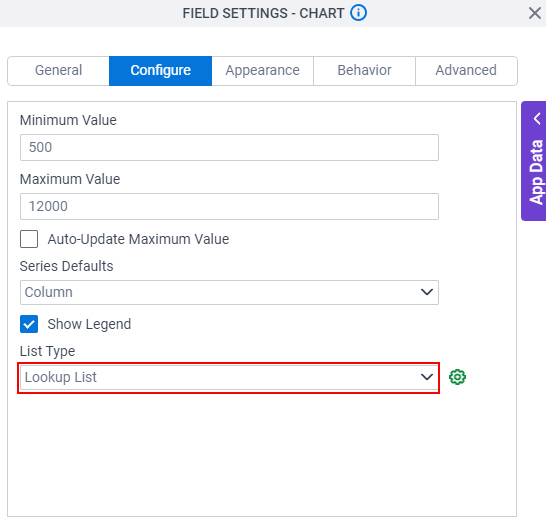
- Click Configure Chart DataSource
 .
.
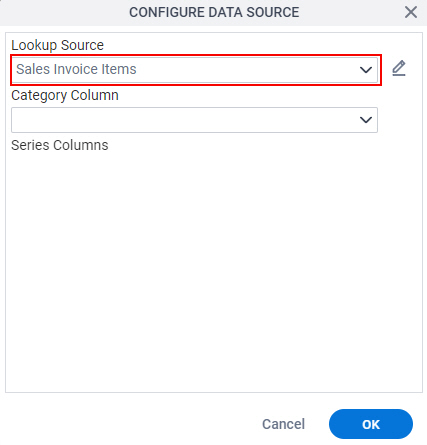
- On the Configure Data Source screen, in the Lookup Source field, select Sales Invoice Items.
In this example, the lookup name is Sales Invoice Items. For information about how to create the Sales Invoice Items lookup, refer to (Example) Configure an Auto-Lookup Form Control with Microsoft Excel
- In the Category Column field, select Product.
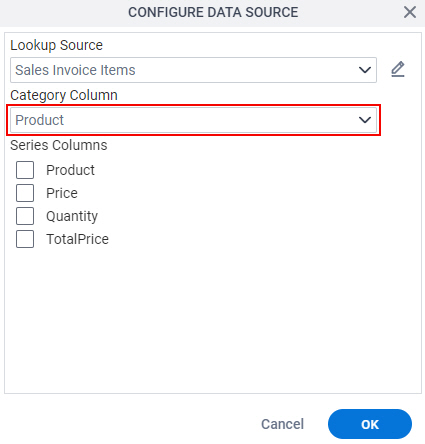
- In the Series Column field, select Total Price.
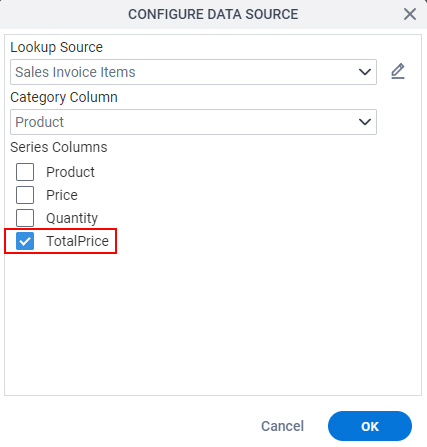
- Click Ok.
The Field Settings - Chart screen shows.
- To save the changes, click Close Screen
 .
.
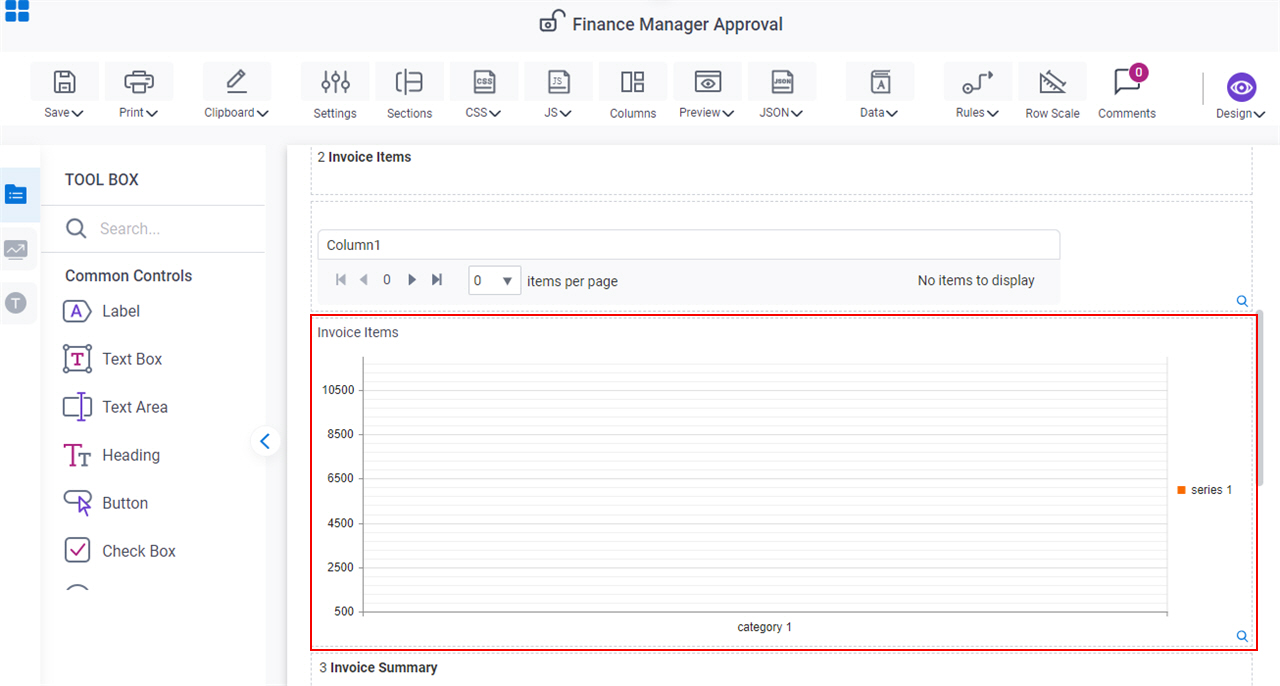
- On the Finance Manager Approval form, expand the Chart form control to the width to show on the eForm.
Step 2: (Optional) Save, Check In, and Publish the Process-Based App
Next, save, check in, and publish the process-based app.
For more information, refer to (Example) Save, Check In, and Publish a Process-Based App.
Step 3: (Optional) Run the App
Next, run the app.
For more information, refer to My Apps screen (Modern)
How to Get the App
This example is based on the Sales Invoice app from the AgilePoint NX App Store. Use this procedure to get the app.
Prerequisites
- AgilePoint NX OnDemand (public cloud), or AgilePoint NX Private Cloud or AgilePoint NX OnPremises v7.0 or higher.
Good to Know
- This procedure is optional. It is provided so you can test the example with an out-of-the-box app.
- This is part of the Background and Setup procedures, but many users preferred this step to appear after the example, not before it.
Procedure
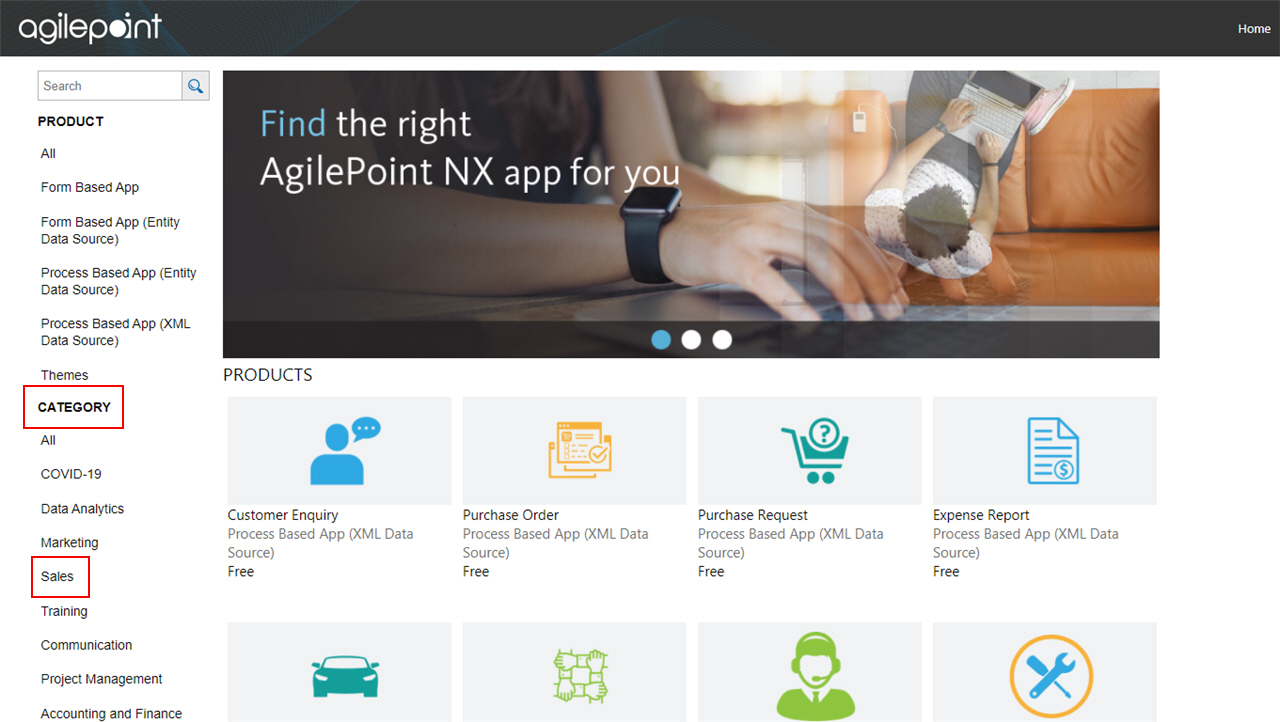
- Click App Store
 .
.
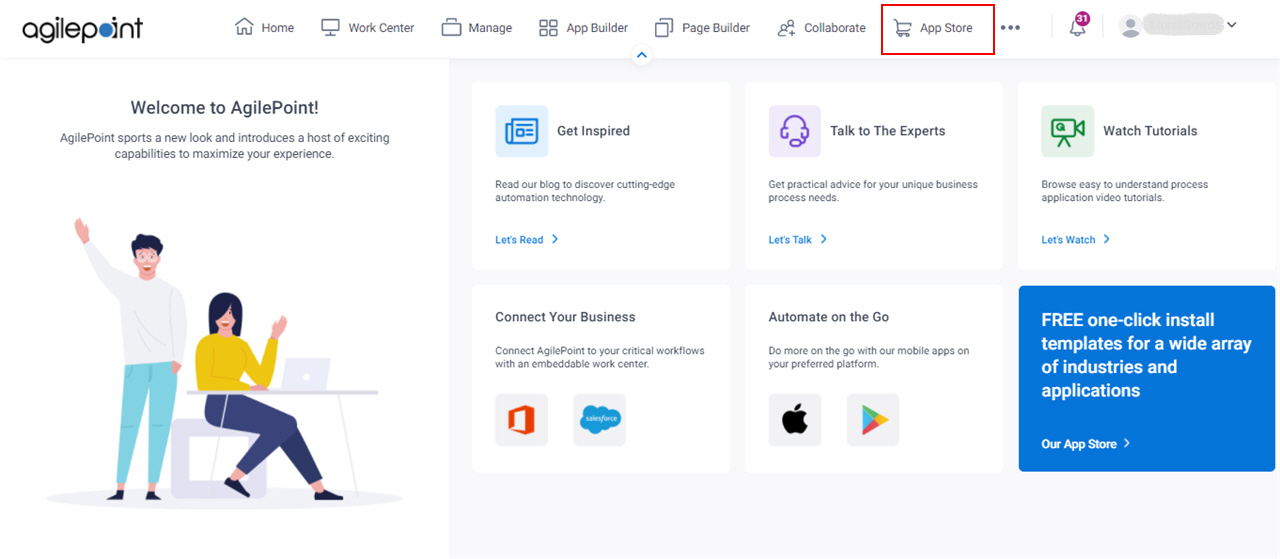
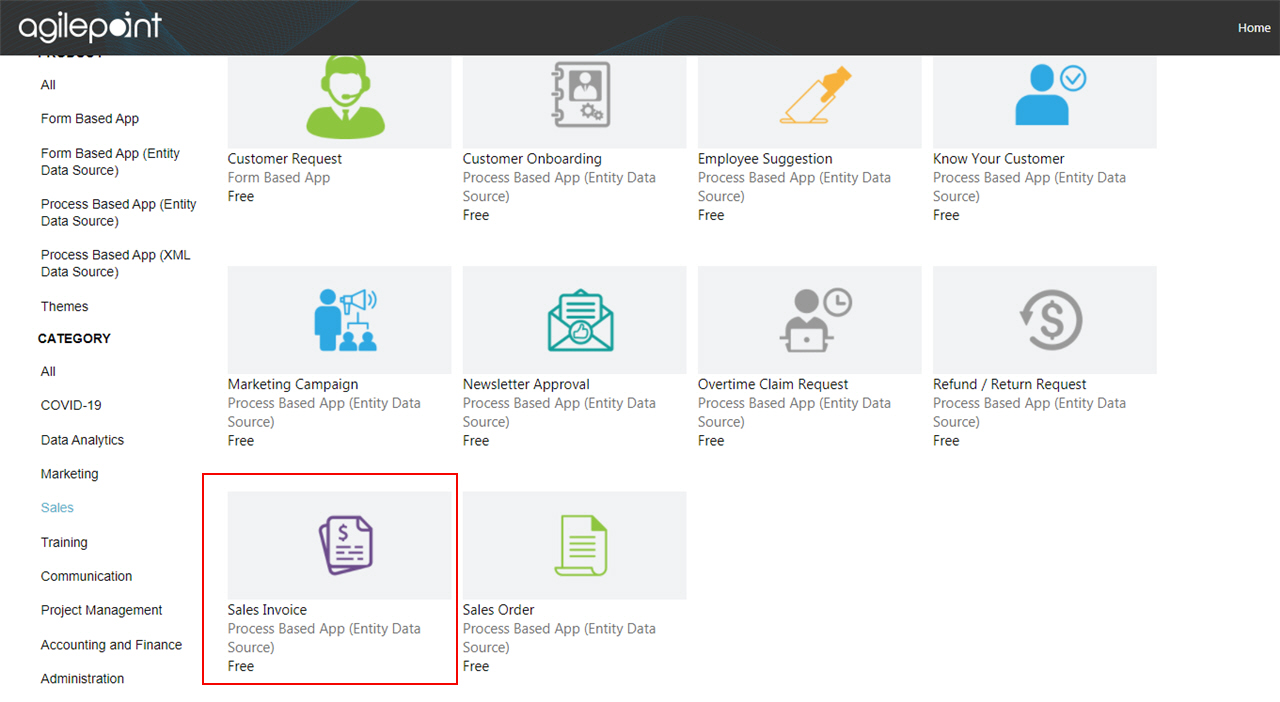
- In the CATEGORY section, click Sales.
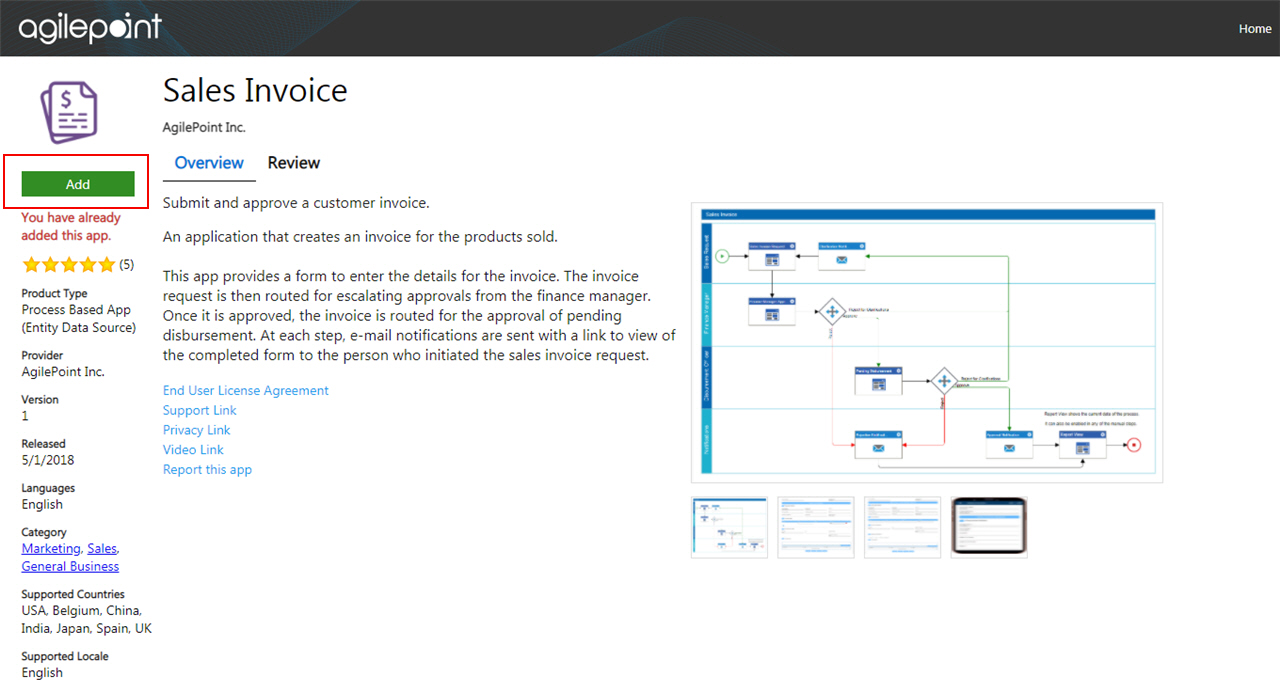
- Click the Sales Invoice app.
- On the Sales Invoice screen, click Add.
- On the Trust App screen, click Trust it.
- Click Return to site.