All Processes - Shows all the processes for all users in your
tenant.
The processes that show in the All Processes view depends upon
various settings. It shows a combination of the processes that
show in the My Processes, My Direct Team, My Direct Team and Sub,
My Department, My Groups, and My Group Peers views.
However, if you are assigned the Administrator role, the All Processes
view also shows the processes for users that are not related to you
in any other view.
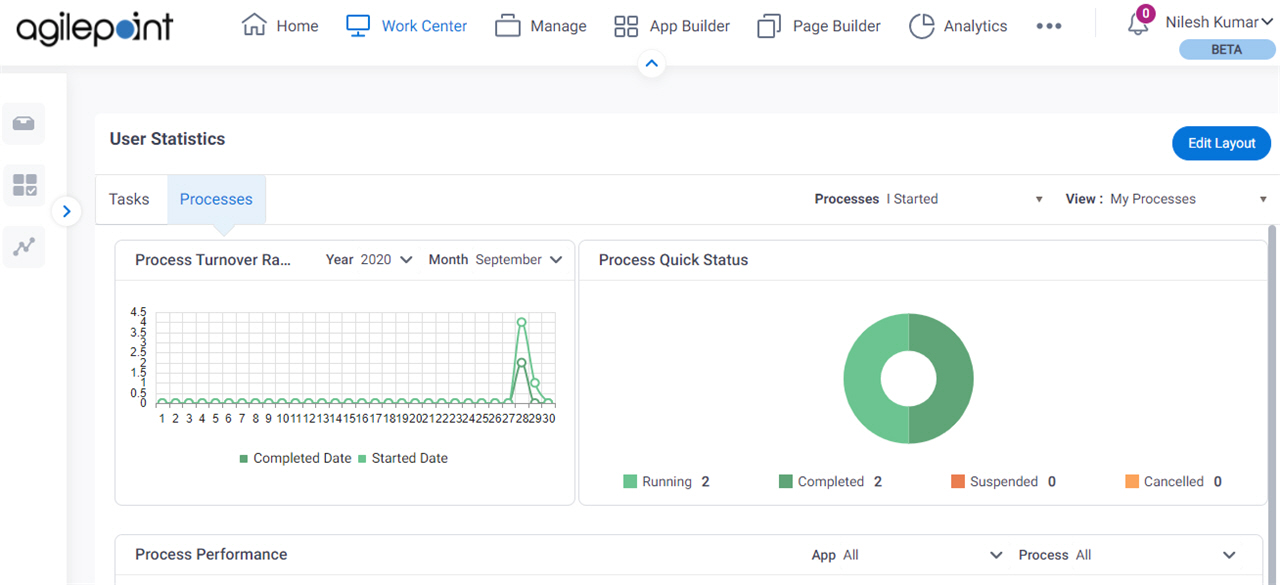
My Processes - Shows the processes where you are a
participant,
either as an individual user,
a groupmember,
or a member of a role.
My Direct Team - Shows your processes, and the processes for any
users for whom you are listed as the manager.
Processes show in the My Direct Team view because your name is
specified in the Manager field on a user's profile in the Manage Center.
For more information, refer toEdit Profile > Basic Information tab.
My Department - Shows your processes and the processes for all the
users in your department.
Processes show in the My Department view because
the value of the Department field in your user profile
in the Manage Center is the same
as the value of the Department field in another user's profile
For more information, refer toEdit Profile > Basic Information tab.
My Team And Subteams - Shows processes for you,
the members
of your direct team, and the members of their direct teams.
This is typically used by higher level managers.
Processes show in the My Team And Sub view because
either your name is
specified in the Manager field on a user's profile,
or you are the manager of the user's manager. You
can change the value of the Manager field in the
Manage Center.
For more information, refer toEdit Profile > Basic Information tab.
My Group - Shows your processes and the processes
for all
members
of all
groups
for which you are the group lead.
Processes show in My Groups because a user is a member of a group where your
name specified in the Group Lead field.
You can change the members of a group or change the group lead in Manage Center.
For more information, refer toEdit Group > Basic Information tab.
My Group Peers - Shows your processes and the processes for
all members
of all groups
for which you are a member.
Processes show in the My Group Peers view because you are a member of a group with
another user. You can add users to groups in the Manage Center.
For more information, refer toAdd Group screen.
Apps I Own - Shows your processes, and the processes for any users for whom you are
listed as the App Owners.
On the Tenant Settings screen, set Enable App Permission Control to Yes
to view this option.
Processes show in the App I Own view because either your name is specified in the Assigned Members field
on a Permission Settings screen, or you are the owner of the app.
For more information, refer to: