Dashboard
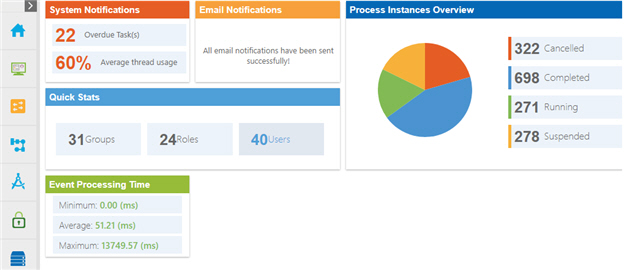
Shows a summary of your system data and business data.

Prerequisites
- To access the Dashboard screen, do one of these:
- On the Add Role > Configure Access Rights > Access Control tab, select Grant View Access to System Monitor and Dashboard.
- On the Edit Role > Access Rights > Access Control tab, select Grant View Access to System Monitor and Dashboard
- This feature requires AgilePoint NX OnDemand (public cloud), or AgilePoint NX PrivateCloud or AgilePoint NX OnPremises v7.0 Software Update 2 or higher.
Video: Manage Your Organization
How to Start
- In the Manage Center, Click Dashboard
 .
.
Fields
| Field Name | Definition |
|---|---|
System Notifications |
|
E-mail Notifications |
|
Process Instances Overview |
|
Quick Stats |
|
Event Processing Time |
|


