Downloads the captured performance of the servers in the cluster
in JSON format to your local machine.
Start Recording
Description:
Starts to record the performance of the servers in the cluster.
Allowed Values:
Selected - Records the performance of the servers in the cluster.
By default, this option records the performance details for 30 minutes.
Deselected - Does not record the performance of the servers.
Default Value:
Deselected
Limitations:
Once you start recording the performance details, the new details override the previously captured details.
To avoid losing the captured details, download them before you start recording.
Refresh.
Function:
Refreshes the information on the Cluster Monitor screen.
By default, the screen refreshes every 30 seconds.
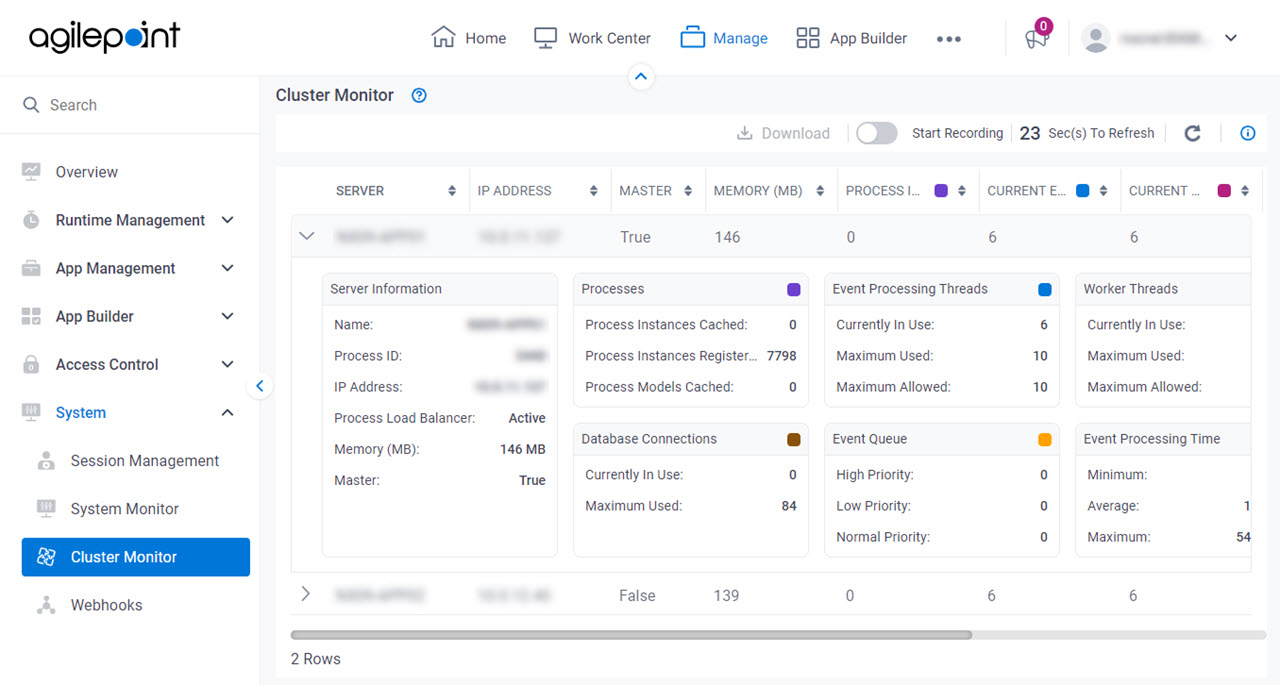
SERVER
Description:
Shows the host name for the server where Cluster Server Manager is installed.
Click the column to sort the servers by host name.
Allowed Values:
Read only.
IP ADDRESS
Description:
Shows the IP address of the server.
Click the column to sort the servers by IP address.
Allowed Values:
Read only.
MEMORY (MB)
Description:
Shows the internal memory (RAM) AgilePoint NX is using on the server.
Click the column to sort the servers by memory usage.
Allowed Values:
Read only.
MASTER
Description:
Specifies whether the server is a master or slave in the cluster environment.
Click the column to sort the servers by server type.
Allowed Values:
Read only.
True - The specified server is the master.
False - The specified server is a slave.
PROCESS INSTANCES CACHED
Description:
Shows the number of process instances
stored in the AgilePoint Server's local memory cache.
Click the column to sort the servers by the number of process instances.
Allowed Values:
Read only.
CURRENT EVENT PROCESSING THREADS
Description:
Shows the number of event threads currently running on the server for AgilePoint NX.
Click the column to sort the servers by the number of event threads.
Allowed Values:
Read only.
CURRENT WORKING THREADS
Description:
Shows the information about the active worker threads on the tenant.
Click the column to sort the servers by the number of workers threads.
Allowed Values:
Read only.
HIGH PRIORITY QUEUE
Description:
Shows the number of high priority event threads in
queue for the process in the cluster.
Click the column to sort the servers by priority.
Allowed Values:
Read only.
AVERAGE EVENT PROCESSING TIME
Description:
Shows the average event processing times for the
process, in milliseconds (ms).
Click the column to sort the servers by the processing time.
Allowed Values:
Read only.
CURRENT DATABASE CONNECTION
Description:
Shows the number of active database connections for the
process instance at present.
Click the column to sort the servers by the number of database connections.