Show a Chart in an eForm
To configure a Chart form control, do the procedure in this topic.
Background and Setup
Good to Know
- You can create a chart to see process data represented by columns in a column chart, bars in a bar chart, lines in a line chart, or slices in a pie chart.
- To get the process data in a chart you can use one of these options.
- Lookup List - Lets you create a chart with a lookup from a specified data source.
- Process Data - Lets you use schema elements to create a chart.
- Triggered from Auto/Manual Lookup - Lets you create a chart with a lookup that starts with Auto-Lookup form control or Pop-Up Select form control. The column nameconfigured for the lookup in your Auto-Lookup or Pop-Up Select form control is reuired.
- The Chart form control only supports multiple column lookups.
How to Start
- Open eForm Builder.
For information about how to open this screen, refer to eForm Builder screen.
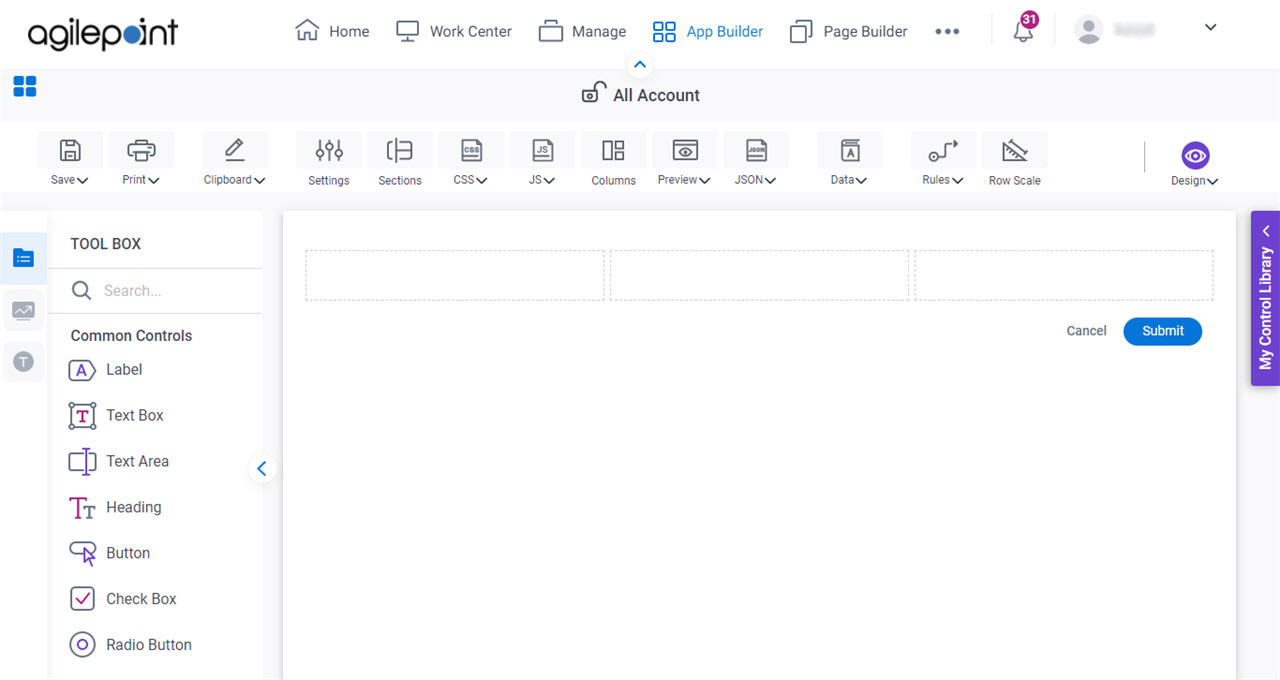
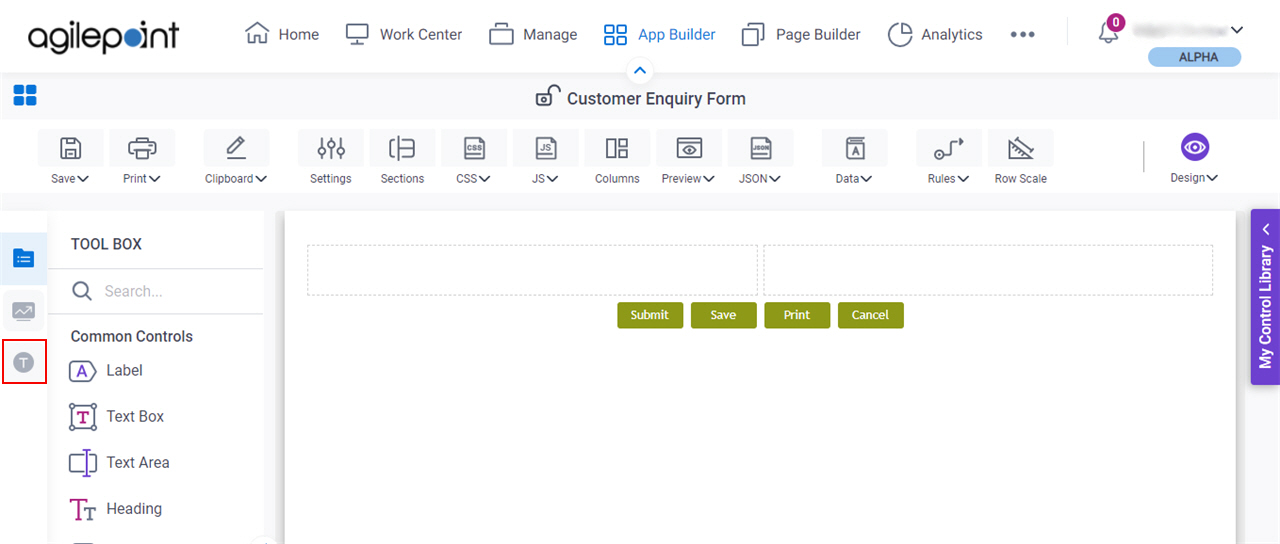
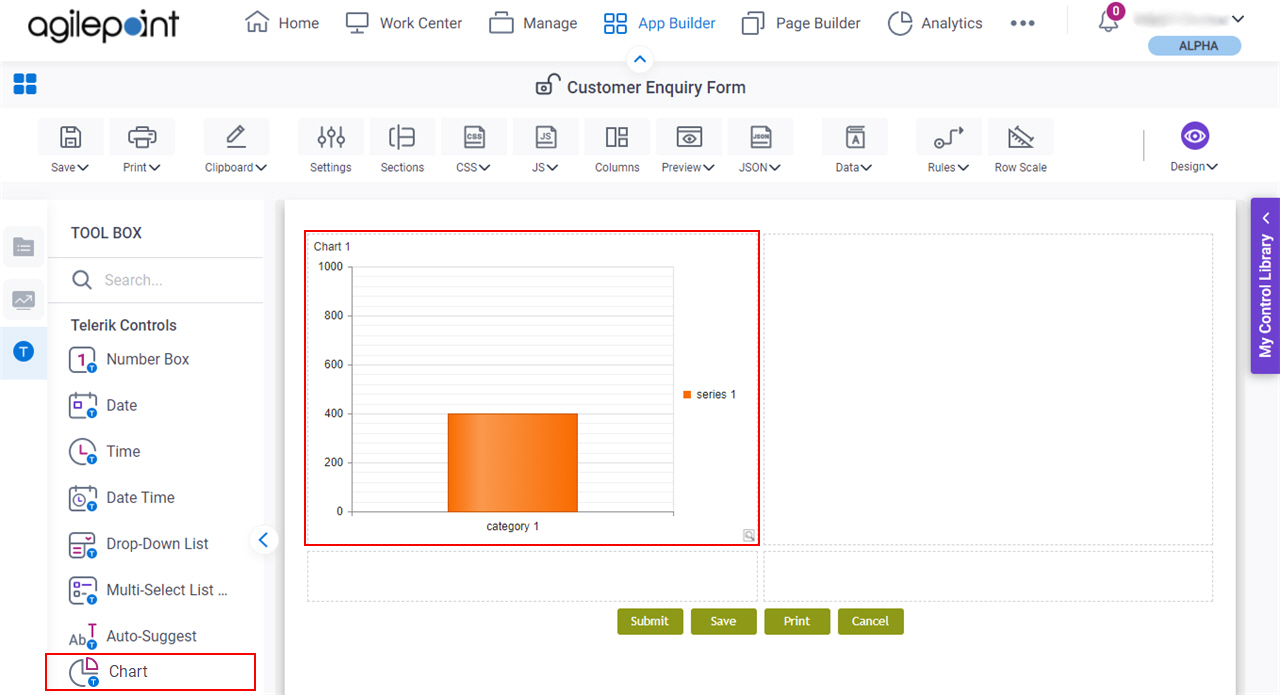
- On the eForm Builder screen, in the Tool Box, open the Telerik Controls tab.
- On the Telerik Controls tab, drag a Chart
 form control onto your eForm.
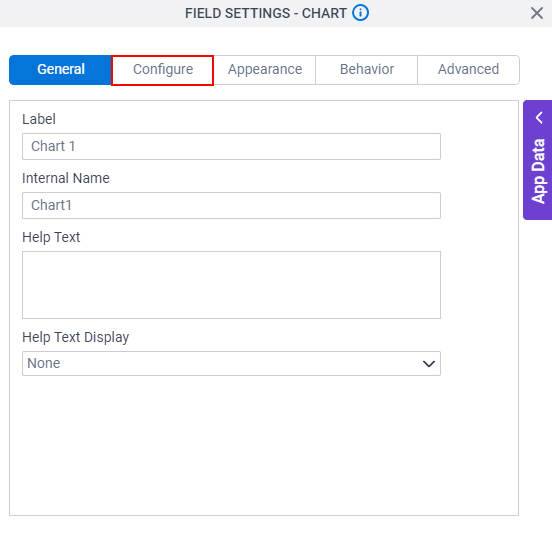
- On the Field Settings - Chart screen, click the Configure tab.
Procedure
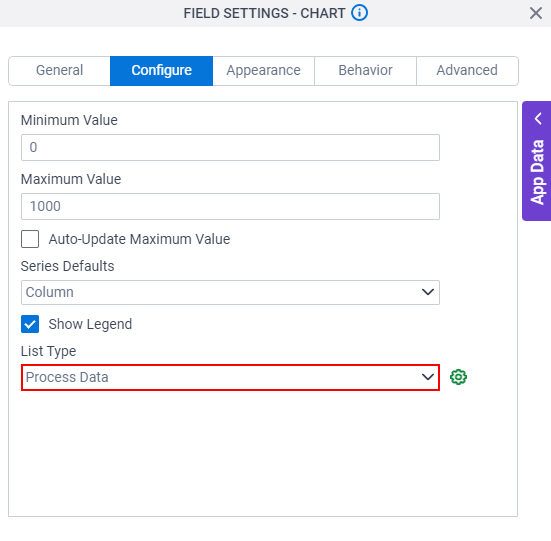
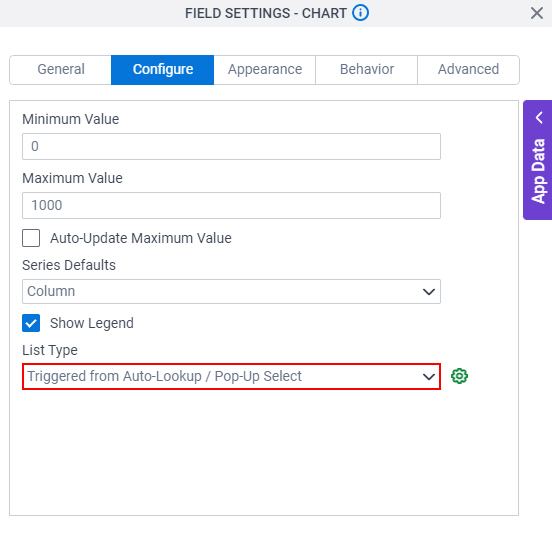
- On the Configure tab, complete these fields.
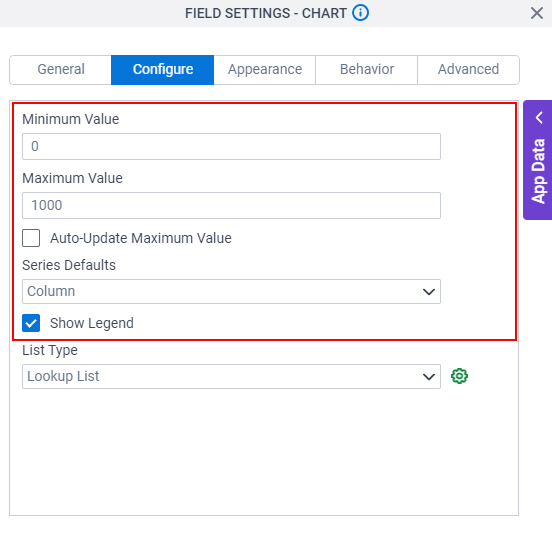
Field Name Definition Minimum Value
- Function:
- Specifies the minimum value for an axis on your chart.
- Accepted Values:
- An integer.
- Default Value:
- 0
- Example:
- Refer to:
Maximum Value
- Function:
- Specifies the maximum value for an axis on your chart.
- Accepted Values:
- An integer.
- Default Value:
- 1000
- Example:
- Refer to:
Series Defaults
- Function:
- Specifies the type of chart to show.
- Accepted Values:
- Column - Shows the chart in a column format.
- Bar - Shows a bar chart.
- Line - Shows a line chart.
- Pie - Shows a pie chart.
- Default Value:
- Column
- Example:
- Refer to:
Show Legend
- Function:
- Specifies if the chart shows a label beside the chart.
- Accepted Values:
-
- Deselected - Shows no label beside the chart.
- Selected - Shows label beside the chart.
- Default Value:
- Selected
- Do one of these:
- To create a chart with a lookup from a specified data source, do this procedure.
- In the List Type field, select Lookup List.

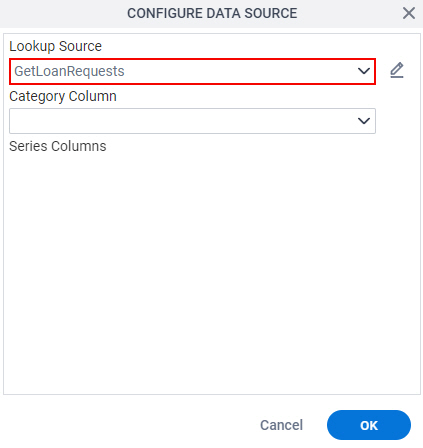
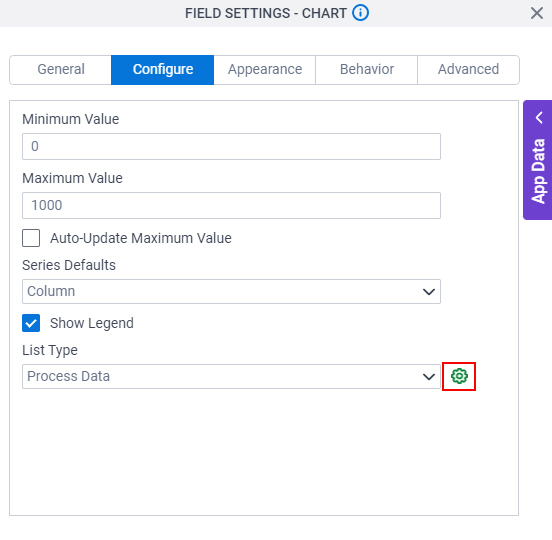
- Click Configure Chart DataSource
 .
.

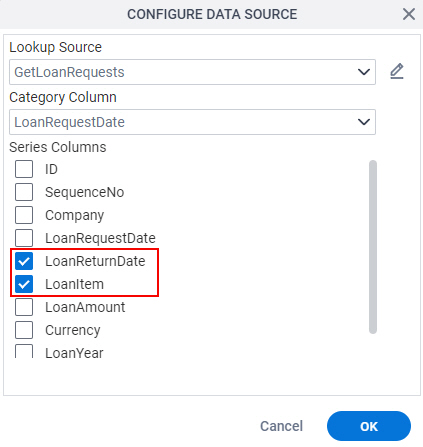
- On the Configure Data Source screen, in the Lookup Source field,
select the name of your data lookup source.
To create a new data lookup source, click Add Lookup
 .
.When you select the name of your data lookup source, the list shows in the Category Column and Series Columns fields.
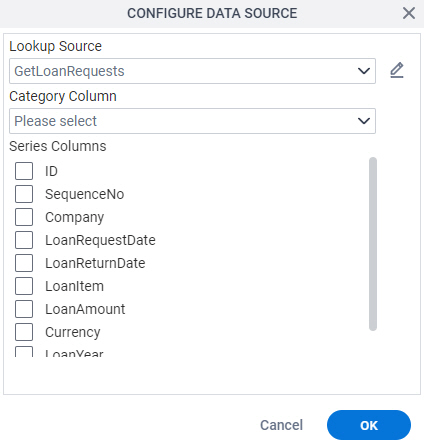
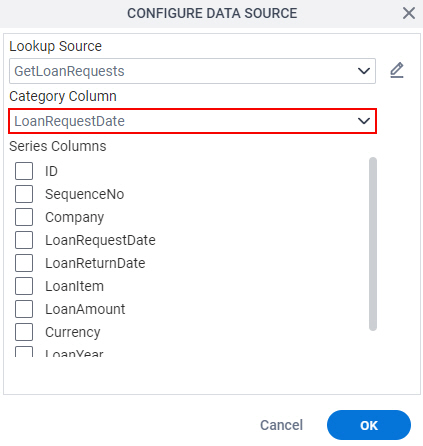
- In the Category Column field, select the name of the column
to show the column value and column name (process data with the column name ) on the x-axis of the chart.
- In the Series Columns field, select the columns to show on the y-axis of the chart.
- In the List Type field, select Lookup List.
- To create your chart with a process data from a schema, do this procedure.
- In the List Type field, select
Process Data.
- Click Configure Chart DataSource .
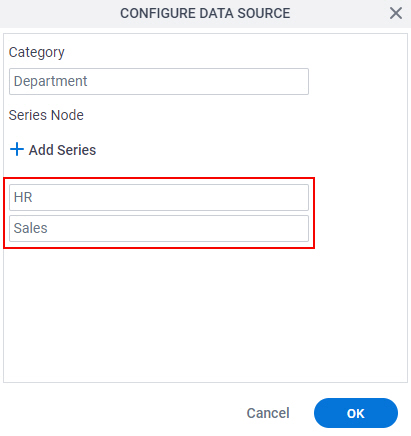
- On the Configure Data Source screen,
in the Schema Root Node field, specify a repeating schema element.
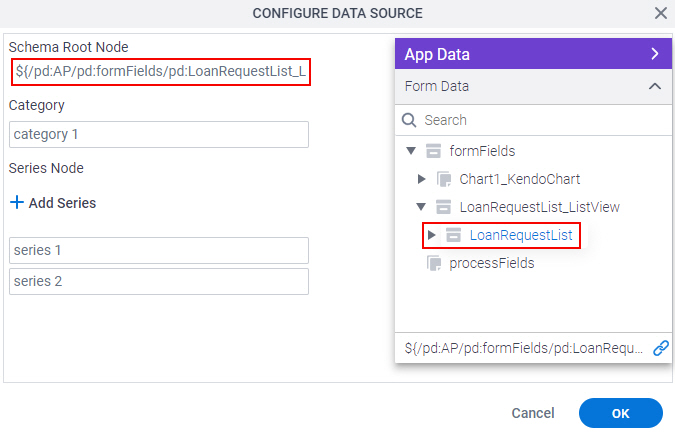
- In the Category field, specify a child element.
The value of your child element shows on the x-axis of your chart.
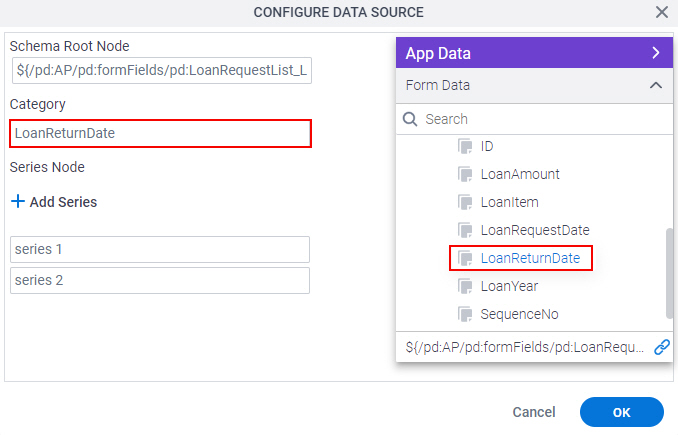
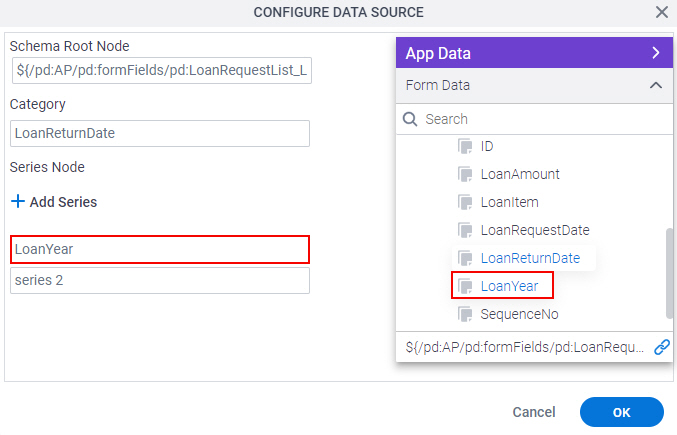
- In the Series Node field, specify a child element.
This child element value shows on the y-axis of your chart.
- In the List Type field, select
Process Data.
- To create your chart with a lookup that starts with an Auto-Lookup or Pop-Up Select form control, do this procedure.
- In the List Type field, select
Triggered from Auto-Lookup / Pop-Up Select.
- Click Configure Chart DataSource .

- On the Configure Data Source screen,
in the Category field, specify the column name to show on the x-axis of the chart.
This must be the same column name that is configured for the lookup in your Auto-Lookup or Pop-Up Select form control.
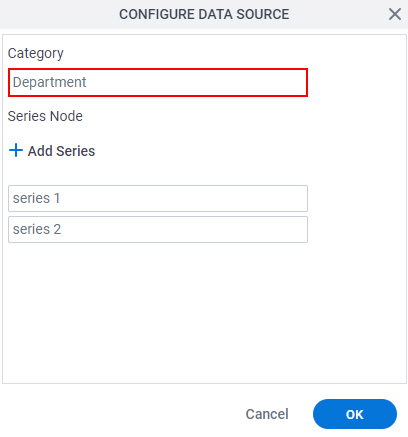
- In the Series Node field, specify the column name to show on the y-axis of the chart.
- In the List Type field, select
Triggered from Auto-Lookup / Pop-Up Select.
- To create a chart with a lookup from a specified data source, do this procedure.