KPI Report Parts
A KPI report part consists of three different tile types each of which can be scaled and has properties that affect the content within the tile.
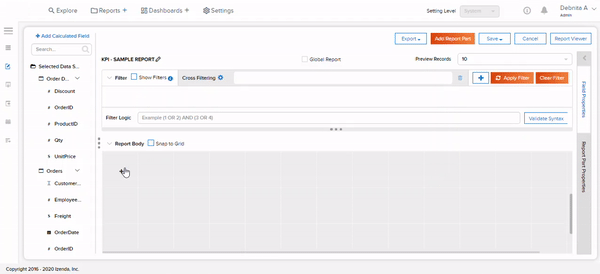
KPI Tiles are arranged relative to each other on an underlying grid, which is only visible in edit mode.
KPIs can have a background image and color and the report part size responds to the size of the underlying grid.
KPIs should be used to visualize simple numerical metrics with text and images to enhance them.
Metric Tiles
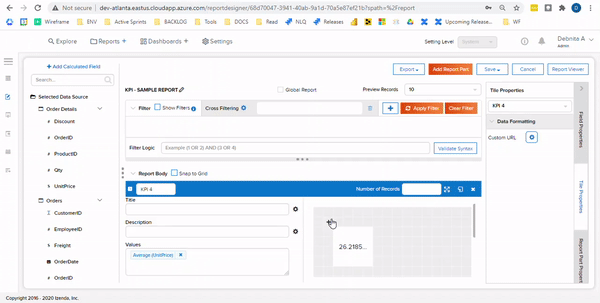
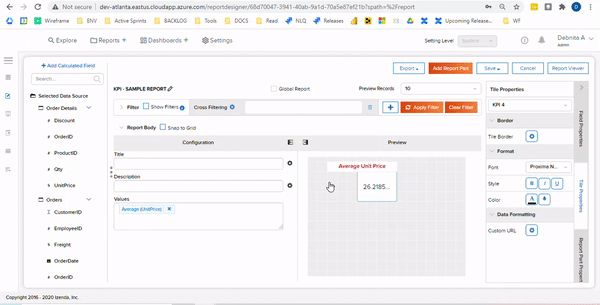
Metric Tiles allow users to insert a value or measure within the KPI.
Metric Tiles can be manipulated with the Report Part Properties, Tile Properties, and the Field Properties in that order of precedence.
Users can only add one Metric Tile to a KPI report part
Text Tiles
Text tiles allow users to input plain text string content.
They can manipulate the look of that content with properties in the tile properties panel.
Any number of Text tiles can be added to a KPI report Part
Image Tiles
Image tiles allow users to insert images into the KPI.
They can manipulate the look of that content with properties in the tile properties panel.
Any number of Image tiles can be added to a KPI report Part
KPI Report Part Properties
Background image can be modified for the KPI report part
Number of rows/ columns and Cell size can be modified
Data Refresh update intervals can be enabled


