
Impact Analysis on AgilePoint NX Portal
The following impact analysis results are based on activities performed in conjunction with loading the Sign In page, Home page, Work Center page and eForms on various browsers like Internet Explorer, Google Chrome, and Firefox.
Objective
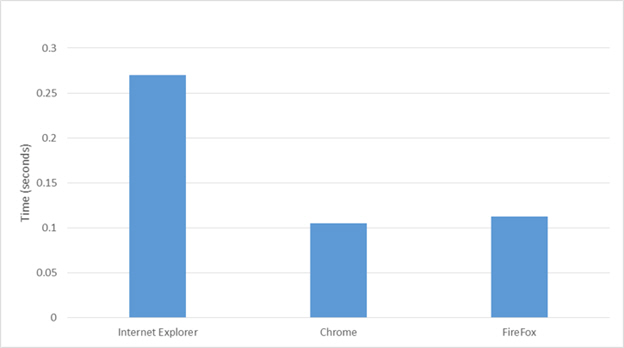
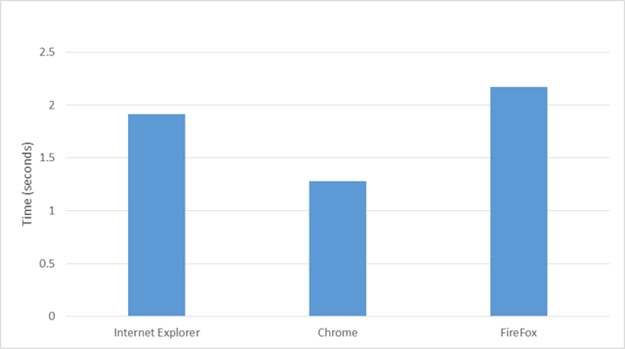
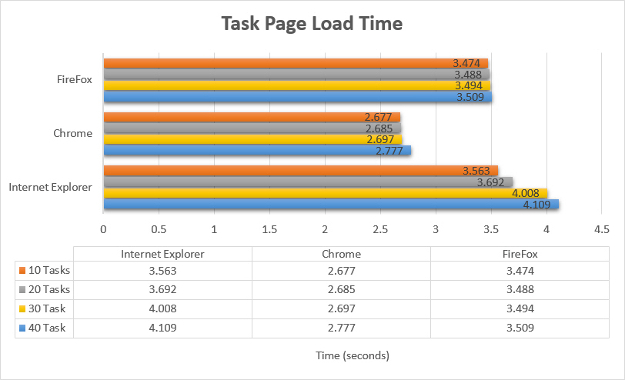
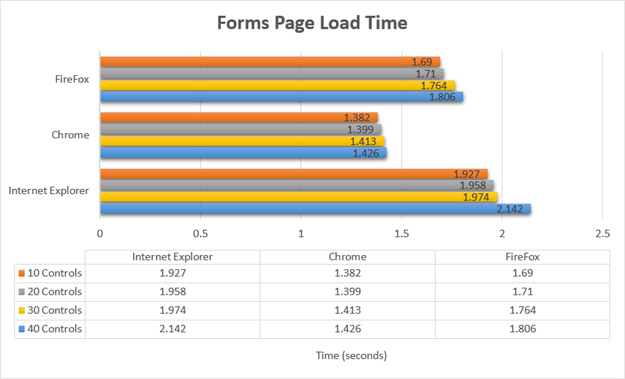
The objective of this test case is to measure the time taken for the Sign In Lpage, Home page, Work Center page with 10, 20, 30 and 40 tasks, eForms with 10, 20, 30 and 40 form controls to load completely in the various browsers like Internet Explorer, Google Chrome, and Firefox.
Test Method
Execution time was captured using the browser developer tool. The developer tool is kept open when each of the page load time is captured.
Test Criterion
Each page load time was captured 10 times. The average page load time is considered for the test result. Tests use a single user because the page execution happens on the client side. It is not required to check the concurrent user performance because page rendering uses the client browser's processing power, rather than server side rendering. Concurrent user performance is required for AgilePoint APIs, which is analyzed elsewhere.
Test Results
Contributing Factors
- Hardware specifications for the client machine.
- Browsers used.
- Network bandwidth.
- For eForms, the performance may vary based of the following factors:
- Number of form controls on the forms
- Data requested from external systems using lookups
- Number of sections in the forms