
Scope for AgilePoint API Performance
- Average time taken to execute AgilePoint APIs in a case where 25 concurrent users are making simultaneous API calls to a server with a load of 500 process instance running. APIs, which are frequently used from the Work Center and form rendering module, are considered for API performance testing.
- Average time taken to execute a few of APIs in case of 1, 10, 25, 50 and 100 concurrent users.
- API performance as the volume of the process instances in the database grows from 50,000 to 50,000,000.
Impact analysis on AgilePoint API
In this analysis, API performance is observed on how it varies along with number of process instances in database grows from 50,000 to 5,000,000.
The analysis is based on the set of APIs, which are frequently called from the AgilePoint NX Portal like Work Center, Manage Center, and for form rendering. API calls are simulated to mock the real case scenario where the server receives a number of requests concurrently and experiences load. Average time taken by an API is been calculated by considering time for successful request, time for AgilePoint Server to prepare the response, and time for receiving a complete response.
Next, API performance is analyzed based comparisons between the number of users making concurrent API calls, starting from 1 User and further sampling at 10, 25, 50 and 100 users with 500 running process instances.
In summary,
Test Method
To do the multiple concurrent API performance testing, JMeter performance analysis testing tool is been used to capture the average time taken for making API calls.
The Apache JMeter application is open source software, a 100% pure Java application designed to load test functional behavior and measure performance.
Test Criteria
The results are based on the JMeter reports, which provides average time taken by each API call based on number of concurrent users and variation in the API performance as the process instances grows.
Test Result
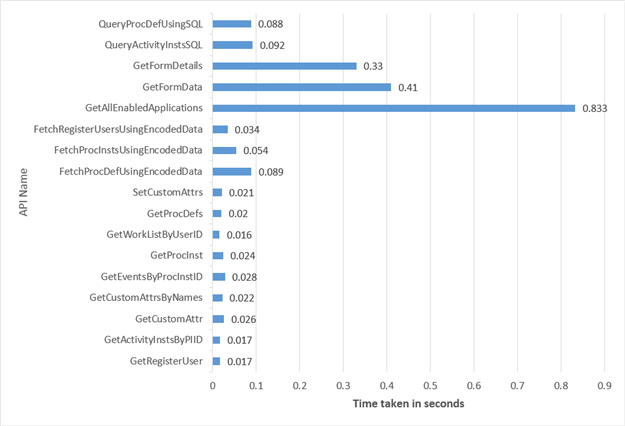
| API Name | API Description | Average in Seconds |
|---|---|---|
GetRegisterUser |
Retrieve AgilePoint registered user details |
0.017 |
GetActivityInstsByPIID |
Get complete activity instance details based on process instance ID |
0.017 |
GetCustomAttr |
Retrieve workflow data for a single process instance |
0.026 |
GetCustomAttrsByNames |
Retrieve process variable for multiple process instances |
0.022 |
GetEventsByProcInstID |
Get all the events associated with a process instance |
0.028 |
GetProcInst |
Get process instance details based on the process instance ID |
0.024 |
GetWorkListByUserID |
Query to get all the manual work items/tasks for a specified user |
0.016 |
GetProcDefs |
Get all process models |
0.02 |
SetCustomAttrs |
Update workflow data for single process instance |
0.021 |
FetchProcDefUsingEncodedData |
Retrieve process model data based on filter criteria |
0.089 |
FetchProcInstsUsingEncodedData |
Retrieve process instance data based on filter criteria |
0.054 |
FetchRegisterUsersUsingEncodedData |
Retrieve AgilePoint registered user details based on filter criteria |
0.034 |
GetAllEnabledApplications |
Retrieve all application metadata details |
0.833 |
GetFormData |
Get the required data for rendering the eForms |
0.41 |
GetFormDetails |
Get eForms related files details for the current form rendered |
0.33 |
QueryActivityInstsSQL |
Retrieve activity instance data based on filter criteria |
0.092 |
QueryProcDefUsingSQL |
Retrieve process model data based on SQL query |
0.088 |
Growth in Average API time taken as the number of concurrent users increases.
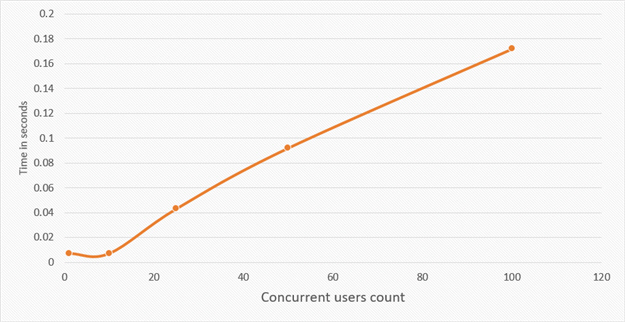
| User count | Average time (seconds) |
|---|---|
1 |
0.007 |
10 |
0.007 |
25 |
0.043 |
50 |
0.092 |
100 |
0.172 |
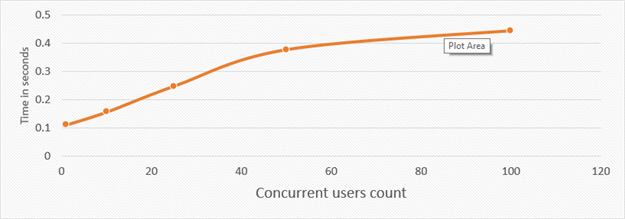
| User count | Average time (seconds) |
|---|---|
1 |
0.11 |
10 |
0.156 |
25 |
0.246 |
50 |
0.376 |
100 |
0.443 |
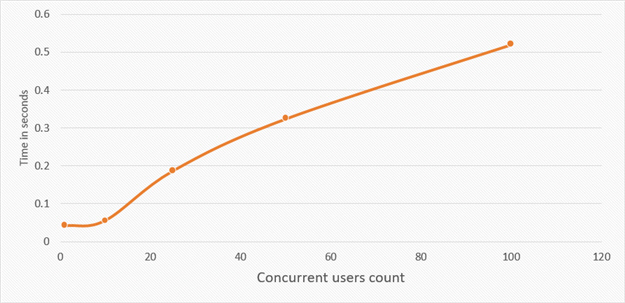
| User count | Average time (seconds) |
|---|---|
1 |
0.041 |
10 |
0.055 |
25 |
0.186 |
50 |
0.324 |
100 |
0.52 |
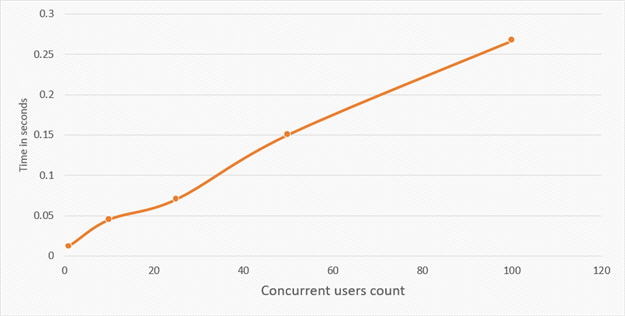
| User count | Average time (seconds) |
|---|---|
1 |
0.012 |
10 |
0.045 |
25 |
0.07 |
50 |
0.15 |
100 |
0.267 |
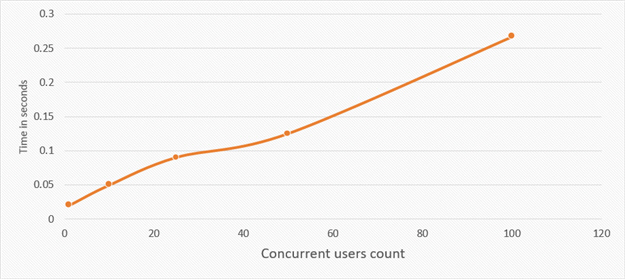
| User count | Average time (seconds) |
|---|---|
1 |
0.02 |
10 |
0.05 |
25 |
0.09 |
50 |
0.125 |
100 |
0.267 |
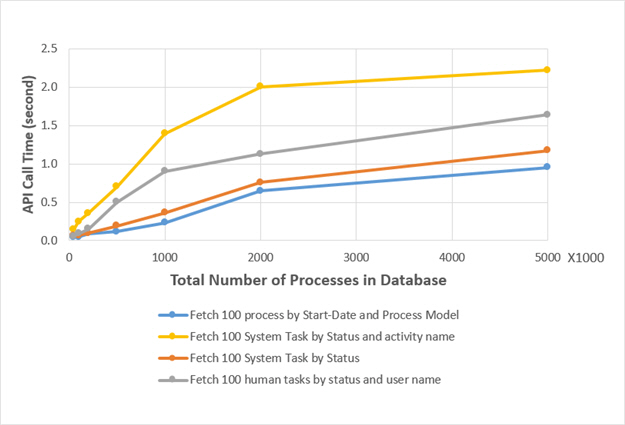
| Total Number of process in Database | 50,000 | 100,000 | 200,000 | 500,000 | 1,000,000 | 2,000,000 | 5,000,000 |
|---|---|---|---|---|---|---|---|
Fetch 100 process by start-date and process model |
0.0453 |
0.0500 |
0.0938 |
0.1188 |
0.2338 |
0.6483 |
0.9525 |
Fetch 100 system activities by status and activity name |
0.1484 |
0.2481 |
0.3579 |
0.7055 |
1.3952 |
2.0049 |
2.2185 |
Fetch 100 system tasks by status |
0.0610 |
0.0688 |
0.1000 |
0.1922 |
0.3642 |
0.7569 |
1.1732 |
Fetch 100 human tasks by status and user name |
0.0594 |
0.0933 |
0.1516 |
0.5031 |
0.9016 |
1.1294 |
1.6396 |
Contributing Factors
- Hardware specifications for the systems where the test is conducted.
- Network bandwidth.
- Usage pattern — i.e., is the load distributed through the day, and does it occur in a random way, or is it a frequent burst of high activity.
- If more users are accessing system, it is required to add more servers into Network Load balancing.
- It is required to increase the AgilePoint Server thread count as the load increases for better performance.