| # Concurrent Users | With SharePoint Web Part | With AgilePoint Web Part | ||||
| Page Load Time (In Seconds) | % Processor Time | Page Load Time (In Seconds) | % Processor Time | |||
| SharePoint | Client | SharePoint | Client | |||
| 15 | 2.86 | 57.4% | 9.38% | 2.82 | 70.3% | 6.57% |
| 50 | 4.56 | 66.0% | 15.9% | 3.95 | 60.9% | 7.88% |
| 100 | 4.35 | 69.3% | 18.4% | 3.84 | 78.1% | 9.58% |
| 150 | 4.02 | 66.5% | 66.5% | 3.54 | 79.5% | 11.7% |
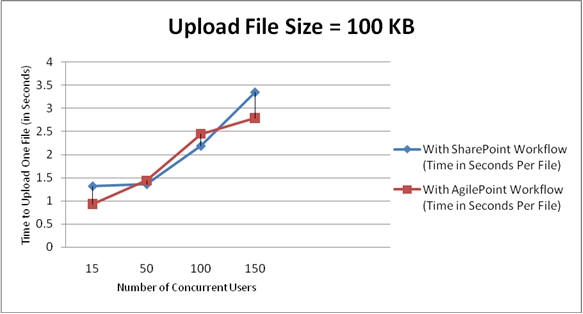
The following graph shows a comparison of the average response times for an AgilePoint Task List versus a SharePoint Task List as the number of items in the list is varied.