| Number of Processes Running (i.e. Tasks Assigned) | Web Page Loading Time | |
| Without AP (Time in Seconds) | With AP (Time in Seconds) | |
| 0 | 0.8416 | 2.5818 |
| 1,000 | 0.8975 | 2.4274 |
| 2,000 | 0.8750 | 2.8703 |
| 5,000 | 0.8952 | 2.5677 |
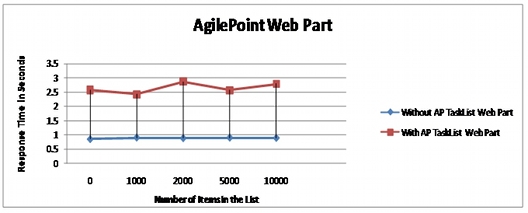
| 10,000 | 0.8847 | 2.7867 |
The following graph the comparison of how average response time for an AgilePoint Task List varies versus the SharePoint Task List as the number of items in the list is varied: