* Duration of test is 2 minutes
| # Concurrent Users | With SharePoint Workflow | With AgilePoint Workflow | ||||
| Average List Item Creation Time (in seconds) | % Processor Time | Average List Item Creation Time (In Seconds) | % Processor Time | |||
| SharePoint | Client | SharePoint | Client | |||
| 15 | 1.80 | 19.8% | 6.96% | 1.03 | 25.9% | 8.28% |
| 50 | 1.05 | 35.0% | 15.5% | 1.58 | 30.5% | 10.4% |
| 100 | 2.15 | 33.3% | 12.2% | 1.96 | 43.2% | 17.9% |
| 150 | 2.83 | 23.2% | 23.2% | 2.67 | 29.5% | 20.5% |
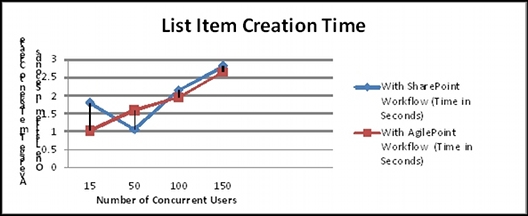
The following graph shows a comparison of the average creation time for a list item in an AgilePoint-enabled List versus a SharePoint List as the load increases.