The Performance Tracing utility allows you to report on performance of custom components such as custom AgileParts, AgileWorks, AgileConnectors, AgileStubs, or Web Services. The performance criteria is based on milliseconds, for example you can write a query to return the most time consuming AgileParts. To use this utility, you will need a database that includes a table called WF_PERF_TRACES (it is not recommended to add this table to the AgilePoint database). You will also need to add a PerfTrace.config XML file to the root level folder where AgilePoint Server is installed (e.g. c:\inetpub\wwwroot\AgilePointServer\). The location of AgilePoint Server can be determined from the registry.
To use the utility to perform performance tracing:
- Create a new table called WF_PERF_TRACES in a database as below. It is not recommended to use the AgilePoint database for this table.
SET ANSI_NULLS ON
GO
SET QUOTED_IDENTIFIER ON
GO
SET ANSI_PADDING ON
GO
CREATE TABLE [WF_PERF_TRACES](
[SOURCE] [varchar](1024) NULL,
[CATEGORY] [int] NULL,
[OBJECT_ID] [varchar](256) NULL,
[TIME_STARTED] [datetime] NULL,
[TIME_SPAN] [int] NULL
) ON [PRIMARY]
GO
SET ANSI_PADDING OFF
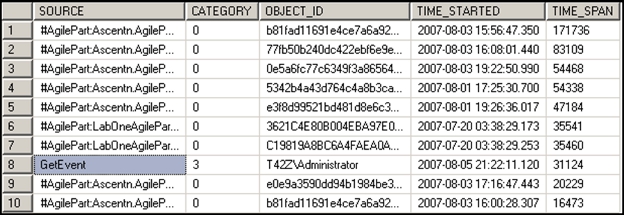
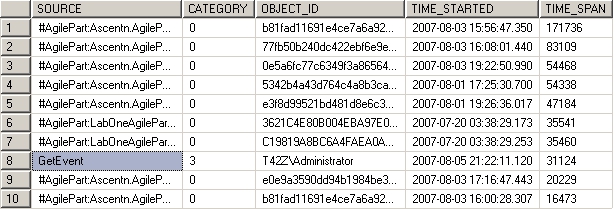
A sample query may return results as shown below:

- In a text editor, create a new file with the following content:, and save it with
the name PerfTrace.config.
<?xml version="1.0" encoding="utf-8"?> <PerformanceTraceSetting xmlns:xsi="http://www.w3.org/2001/XMLSchema-instance" xmlns:xsd="http://www.w3.org/2001/XMLSchema"> <Database> <Vendor>MSSQLDatabase</Vendor> <Connstr>server=localhost;database=lock;trusted_Connection=yes</Connstr> </Database> <Filter> <Category>TrackingEvent</Category> <Category>WebService</Category> <Category>ProcessEventHandler</Category> <Category>AgilePart</Category> </Filter> <MinimumTimeSpan>10</MinimumTimeSpan> </PerformanceTraceSetting> - Save the file to the following path and file name:
[AgilePoint Server installation root]\PerfTrace.config
- Configure PerfTrace.config as follows:
- Within the Database section, enter the database vendor and connection string for your performance tracking database.
- The Filter section allows you to add the categories for which you
want to report on. The categories that are available include:
- AgilePart – Reports on all AgilePart data.
- ProcessEventHandler – Reports on AgileWork and AgileStub data.
- TrackingEvent – Reports on AgileConnector data.
- WebService – Reports on Web Service data.
When doing the reporting, a few of the filtering options that are available include:
- Exclude Categories - To exclude one or more of the categories, remove the category from the PerfTrace.config file. For example, remove the <Category>WebService</Category> to tell AgilePoint Server to exclude Web Service tracing data from being recorded to the database.
- When writing your SQL, each category has been assigned a numerical
identifier for filtering. This allows you to report only on a certain
category. Each category is identified as follows:
- AgilePart – 0.
- ProcessEventHandler – 1.
- TrackingEvent – 2.
- WebService – 3.
A couple of sample query statements are shown below:
select * from WF_PERF_TRACES where source like
'%Sample%' order by time_span desc
select * from WF_PERF_TRACES
where  category = 0 and source like '%Move%'
order by time_span desc
A sample query may return results similar to below:

