Drill Downs
Creating A Drill Down
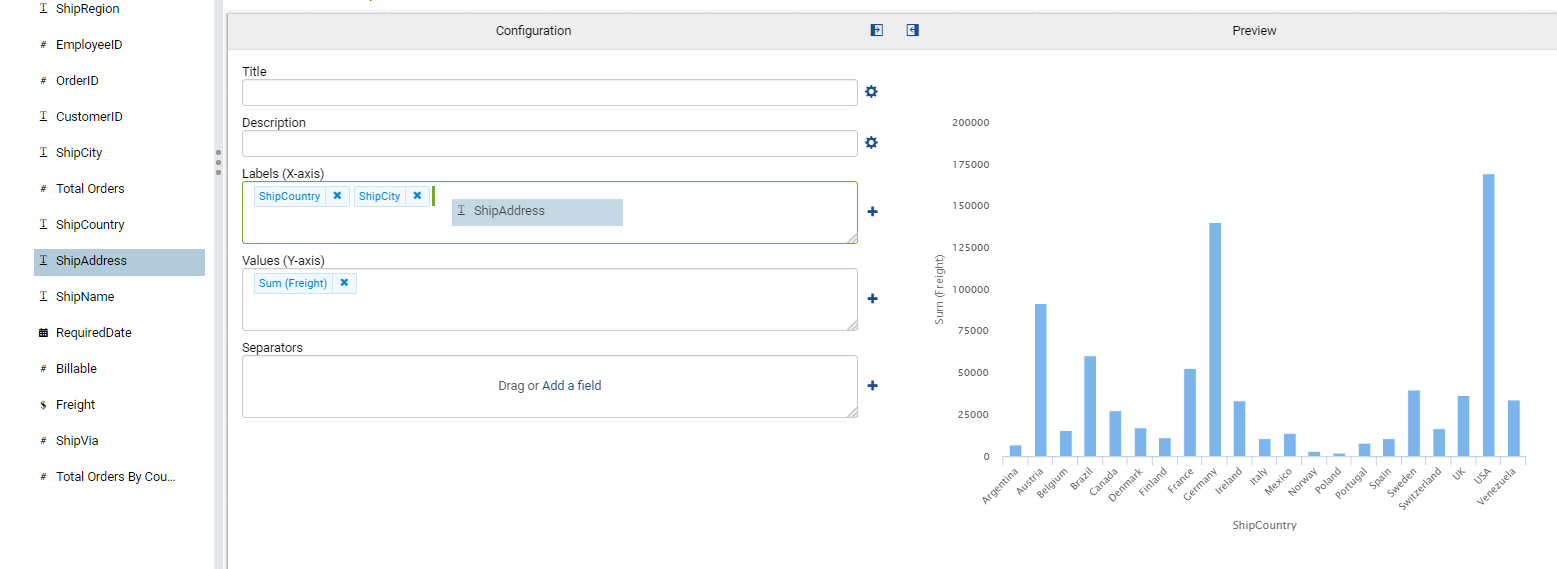
Drill downs can easily be created by adding multiple fields to the labels portion of the report designer. This indicates to Analytics Center the fields on the left can be partitioned by the fields to the right.

Fig. 297 Adding Fields to Report
To utilize the drill down, click on a column, such as USA. Doing so will render the next level partitioned data of ShipCity by the selected ShipCountry.
Fig. 298 Top Level Drill Down
For the next data level down, all Cities inside the USA are rendered on the x-axis of our report. The y-axis values scales down corresponding to the smaller Freight values present at each City.
To contiune drilling down, click a column, such as Boise.
Fig. 299 Second Level Drill Down
Upon clicking the Boise field, the final level of the drill down is displayed. All available Addresses for Boise are rendered on the x-axis of our report.
Fig. 300 Third Level Drill Down
Other Drill Down Chart Types
Drill downs function similarly for other Chart report part types. Clicking on the space or point representing the data will navigate to a lower level of data.
Drill downs are also available for:
Line
Column
Bar
Area
Pie
Funnel
Combination
Tree